8 UK stock screeners you should try
In this article, we compile a list of eight UK stock screeners that can help you spot opportunities in the stock market by filtering through thousands of shares.
Screening for UK stock opportunities
Traders can focus their attention on stocks that meet specific trading or investing criteria by using a stock screener. A stock screener is the software used to find stocks. A scan is then created using criteria that we want a stock to meet (or not meet), and parameters are the values that we want our criteria to fall between.
A UK stock screener allows you to input various metrics and then shows you a list of stocks that meet specific criteria. This is useful for stock selection and narrowing down research time. Here are eight UK stock screeners you can try out.
List of stock screeners
1. TradingView
TradingView’s stock screener analyses approximately 4,000 UK stocks. These can all be sorted based on different pre-set metrics. For example, selecting the Valuation tab shows market cap, P/E, price/revenue, EPS and more. The trend-following tab shows how each stock ranks in terms of its moving averages and other technical indicators.
You can click on any one of these metrics to rank by that metric. For example, click on P/E to see the stocks with the lowest or highest price/earnings ratio.
To narrow down the number of stocks, choose from more than 15 stock scans, including Volume Leaders, Top Gainers, Most Volatile, and Earnings this Week.
Adjust existing screeners or create your own by clicking the Filters tab. Here you’ll have access to hundreds of technical and fundamental criteria to create a list of stocks that meet your exact parameters. Assuming you have at least a free account, the scan can be saved.
2. BarChart
The BarChart UK stock screener offers a variety of fundamental and technical criteria from which to create a stock scan. To add a filter, use the Add a Filter box and select from the dropdown menus. Once selected, specify the parameters. For example, if choosing a 200-day moving average, add it and then input where you want the price in relation to it.
Creating and saving stock scans requires you to create a free account. The site offers a number of pre-set scans, including Gap Up & Gap Down, Five Day Gainers, New Recommendations, and Volume Advances.
3. Wallmine
When the UK is selected as the country, Wallmine will scan through 1,639 companies. There is no sign up required to create and run a scan, but a free account is required to save it.
You can choose from a variety of fundamental and technical criteria via the Add a Filter dropdown. There are about 65 criteria, which work well for basic scanning, but may not meet the needs of someone looking for very specific criteria or a technical indicator to include.
Once a criterion is selected, the parameters for that criteria can be customised precisely, such as asking for P/Es specifically between 3 and 7.
The main attraction of this site for many investors is the tables. Once you have produced a scan list, you can view the results using more than 20 different layouts that provide different information about the stocks. This allows for a more thorough analysis and looking at the stock from multiple angles, not just as a result of the metrics that were scanned for.
4. Finviz
Finviz will only scan for UK companies listed on US exchanges, since it is a US stock screener. This may help if trading on US exchanges but will have limited functionality for users wanting to trade stocks on the London Stock Exchange (LSE), for example. Finviz can scan through approximately 86 UK companies.
The Finviz layout is intuitive and highly visual. The available criteria are organised under three tabs: Descriptive, Fundamental and Technical (or click the All tab to view all the criteria).
Scanning is free, but saving the scan requires a free account. Customising the parameters of a criterion requires a monthly subscription.
See the scan list through multiple lenses by clicking on the various tables. Performance shows how all the stocks on the list have performed over several time frames, while the Charts tab shows charts of all the stocks on the list for quick visual comparison.
The screener can also look for chart patterns and candlestick patterns based on the daily chart.
5. Investing.com
Once the UK is selected as the country, Investing.com will scan through approximately 2,715 stocks. There are both fundamental and technical criteria to choose from, although the options are limited compared to BarChart and TradingView. For example, there is no moving-average criteria, one of the most common technical analysis indicators.
The screener can look for candlestick patterns, which may help with trade selection. The scanner shows on which time frame the pattern is occurring, from one-minute charts up to weekly charts. A free account is required to save scans.
6. MarketInOut
MarketInOut will scan through more than 3,420 UK stocks. You can view three results from the scanner for free. However, to see the whole list requires a subscription and a free trial isn’t offered.
The screener provides plenty of criteria, both fundamental and technical. It can find chart patterns, candlestick patterns and technical divergence. In addition, it’s possible to compare stocks to their peers and industry ratios.
7. FT.com
The Financial Times stock screener filters through approximately 6,800 UK companies. To use this screener, first, select the UK as your country, then add in additional criteria to narrow down the list. This screener is mostly comprised of fundamental criteria, like P/E and company growth statistics.
This screener has virtually no technical analysis criteria to add to the scan. This may limit its usefulness for technical traders, but fundamental traders may appreciate its simple layout and functionality.
Scans can’t be saved. You’ll need to input the criteria each time you want to run a scan or keep the browser window open and refresh the results by clicking Go on the scanner.
Screening on our Next Generation trading platform
Our award-winning Next Generation trading platform provides some pre-set scans that traders can use to find potentia
l stock trades. In the Product Library, under ‘Topical’, there are several useful watchlists that are made up of a number of asset classes, including stocks.
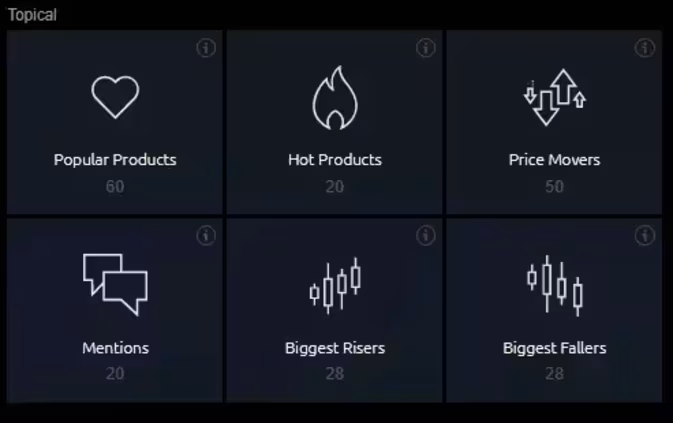
Popular Products shows the most popular trading instruments on our platform.
Hot Products is updated hourly to show stocks with high volume relative to average volume.
Price Movers highlights assets that have experienced a large move up or down, when compared to how the asset typically moves.
The Mentions tab features assets recently discussed by our expert market analysts.
Biggest Share Risers is a list of the top four daily percentage gainers in each asset class.
Biggest Fallers lists the top four daily percentage losers in each asset class.
To see live stock prices, you’ll need to sign up for a live account.
4 popular screens to do on UK stocks
1. Stock price is above 50/100/200-day moving average
Use one moving average, or all three. The 200-day moving average helps determine the longer-term trend. The 100-day and 50-day help determine the shorter-term trend. If the price is above all three, it indicates the price is rising and likely in an uptrend. This is a good basic stock filter for finding stocks in uptrends and eliminating stocks in downtrends.
2. P/E ratio below 10 with EPS growth
This is a scan to find possible value stocks. P/E ratios show the stock price relative to the company’s earnings. P/Es of 10 and below are generally considered medium to low (the lower you go, the better the perceived value), which means the price is low compared to the companies earnings, possibly indicating a good price to buy.
P/E ratios only tell part of the story. P/E may be low because the company’s earnings are shrinking. Consider combining the P/E ratio scan with an earnings growth criteria, looking for stocks that have both increasing earnings and are trading at a low valuation.
3. New 52-week highs
A stock that has recently hit a new 52-week high means it’s experiencing upward momentum and its highest share price in the last year. The list may include stocks in strong uptrends, a stock that has been beaten down over the last year but is starting to move up, or stocks that have good news out and are surging to new highs.
4. 50- and 200-period moving averages crossover
When the 50-period moving average crosses above the 200-period moving average, it can signal that an uptrend is starting. When the 50 crosses below the 200, it can signal a downtrend is starting. These moving averages may be useful for longer-term trades on higher chart intervals such as weekly and monthly. For shorter-term trades, try looking on lower timeframes such as a four-hour or daily chart.
Disclaimer: CMC Markets is an execution-only service provider. The material (whether or not it states any opinions) is for general information purposes only, and does not take into account your personal circumstances or objectives. Nothing in this material is (or should be considered to be) financial, investment or other advice on which reliance should be placed. No opinion given in the material constitutes a recommendation by CMC Markets or the author that any particular investment, security, transaction or investment strategy is suitable for any specific person. The material has not been prepared in accordance with legal requirements designed to promote the independence of investment research. Although we are not specifically prevented from dealing before providing this material, we do not seek to take advantage of the material prior to its dissemination.
A benefit of a stock screener is that it can scan through hundreds of stocks in seconds, saving you time. A specific scan can often be saved and run at any time and it presents a shorter list of shares to consider for trading. The stock screener can also be used as part of a stock trading strategy, requiring that any stock traded meets specific criteria as determined by the scanner.
A limitation of a stock screener is that it’s purely mechanical and will eliminate stocks that fall even a tiny amount outside of the specific scanner criteria. For example, if there is a filter that says only show stocks that are above their 200-day moving average, a stock that is 0.01% below won’t show up in the results, even though it may be a good stock. Therefore, you may want to brush up on your technical analysis skills so that you can conduct your own analysis also.