The 7 best indicators for TradingView
Discover the best TradingView indicators and learn how to use them to optimize your trades.
What are TradingView indicators?
TradingView indicators collate a vast range of historical data – such as opening and closing prices, minimum and maximum prices, and trading volumes – to enable you to analyse financial instruments and make informed trading decisions. Many traders use these technical indicators to plan their trades, establish entry and exit points, and forecast future price movements.
In this article, we look at seven of the most useful technical indicators on TradingView:
Relative strength index (RSI)
Moving average (MA)
Moving average convergence divergence (MACD)
Bollinger bands
Fibonacci retracement
Stochastic oscillator
Volume profile
Where can I find TradingView indicators?
You can access the above indicators and many others in TradingView. First, bring up a chart: from the TradingView homepage, select Products in the top navigation bar, select Supercharts, and search for the financial instrument you wish to view. Then select Indicators from the navigation bar above the chart and select or search for the indicator you’d like to add to your chart. To save an indicator in your favourites tab, select the star icon to the left of the indicator.
TradingView’s top 7 technical indicators
1. Relative strength index
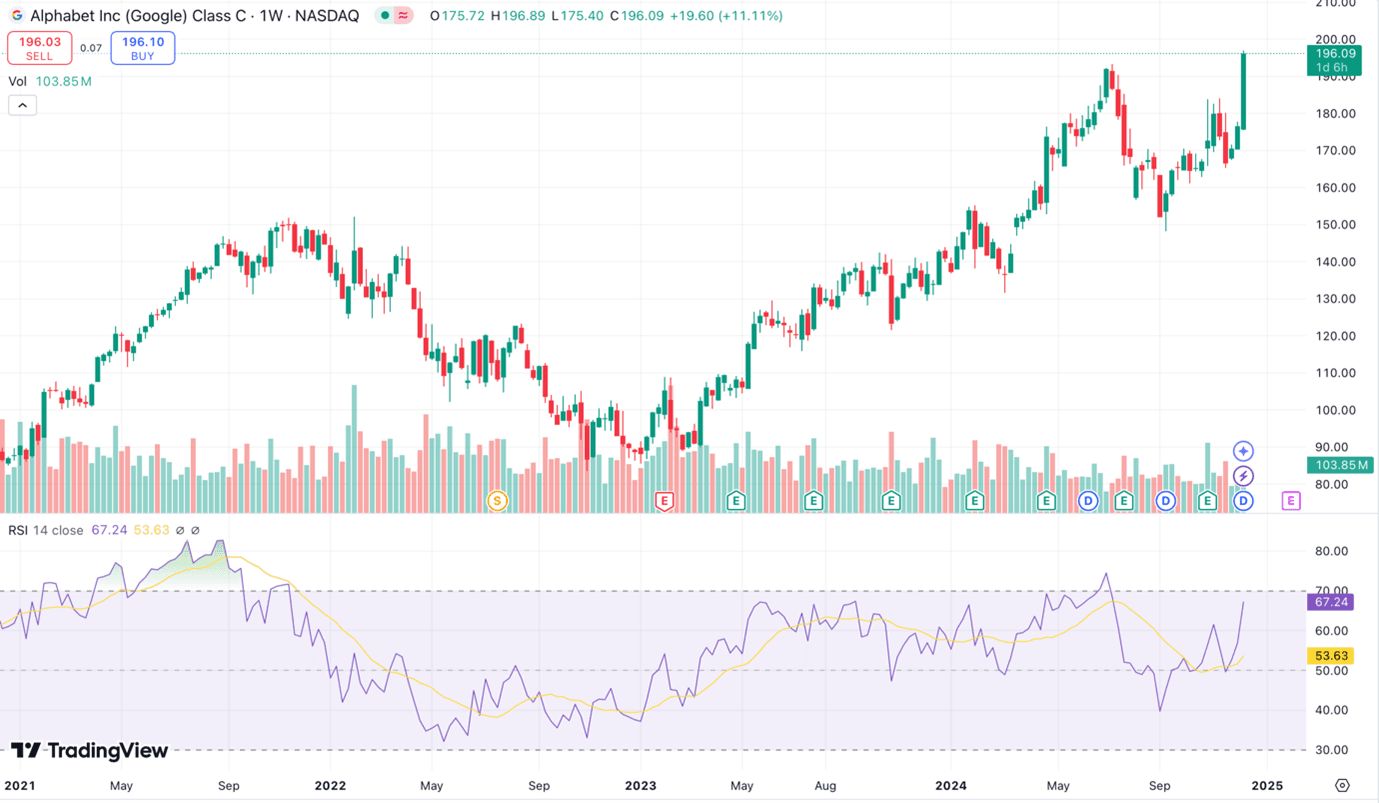
The relative strength index (RSI) is a momentum indicator measuring the speed and magnitude of a financial instrument’s price movements. The RSI, typically shown on a line graph below the instrument’s price chart, works on a scale of zero to 100. A reading of 70 or above generally indicates overbought conditions, while a reading of 30 or below typically suggests oversold conditions. The reading is based on a comparison of an instrument’s strength on days when its price rises to days when its price falls.
Many traders use the RSI when trying to confirm or time an entry or exit into a market. That said, the tool may be most helpful when combined with other TradingView indicators, and supported by a trader’s awareness of market trends. In isolation, an instrument’s RSI moving above 70 or below 30 is not enough to justify a trading decision.
2. Moving average
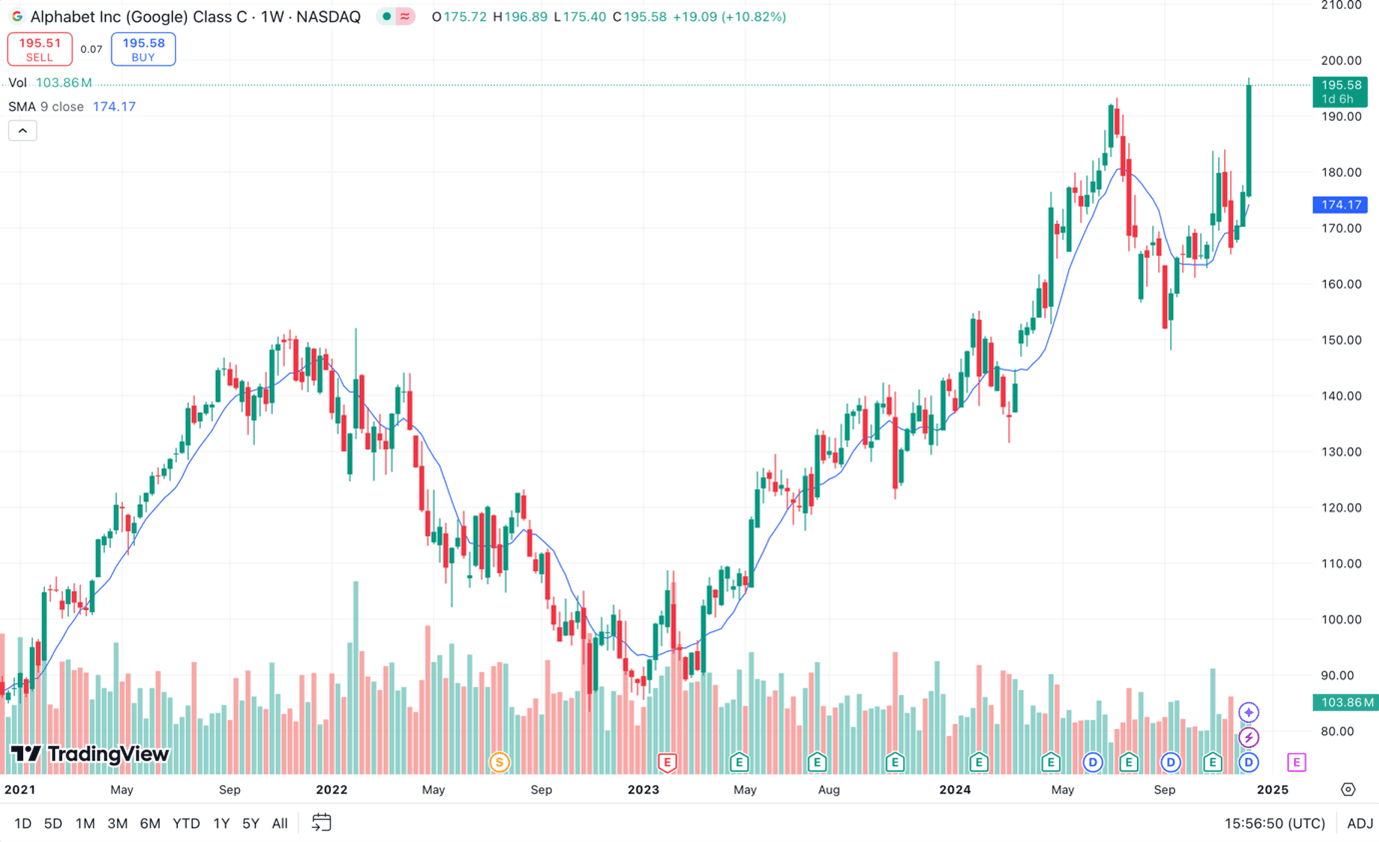
The moving average (MA) indicator allows traders to see trends in a financial instrument’s price over time, smoothing out the ‘noise’ of short-term price fluctuations. Plotted as a line graph, the MA is a constantly updated average price over a specific period, usually shown as an overlay on an instrument’s price chart.
Traders can use a simple moving average (SMA), or an exponential moving average (EMA) which gives more weight to recent price changes. Volume-weighted moving averages (VWMA) can also be useful when seeking early buy or sell signals in fast-moving markets.
Traders often use MAs to identify trend directions and potential points for retracement or stops. For example, if an instrument dips to its 200-day EMA, a trader might expect the price to rebound, with the EMA potentially acting as a support.
3. Moving average convergence/divergence
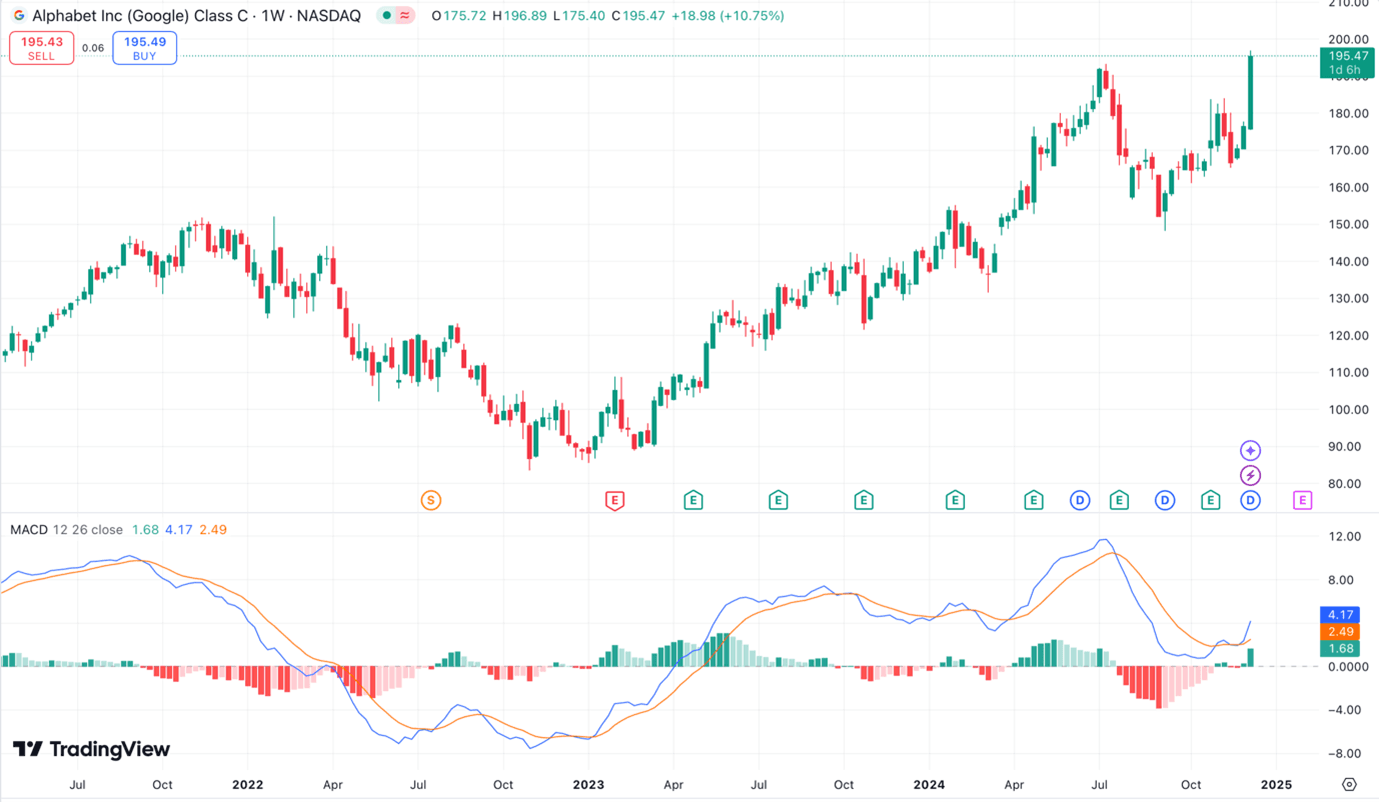
The moving average convergence/divergence (MACD) is a momentum indicator that can help traders identify trends and potential trade opportunities.
Made up of three parts, MACD charts include the MACD line (representing the distance between a shorter moving average and a longer moving average), the signal line (showing changes in price momentum), and a histogram (illustrating the difference between the MACD and the signal lines).
The MACD is one of the most popular technical tools because it shows the direction of a trend and the strength of buy or sell signals. As with all indicators on TradingView, it should be used in conjunction with other indicators, particularly as it is a short-term gauge.
4. Bollinger Bands
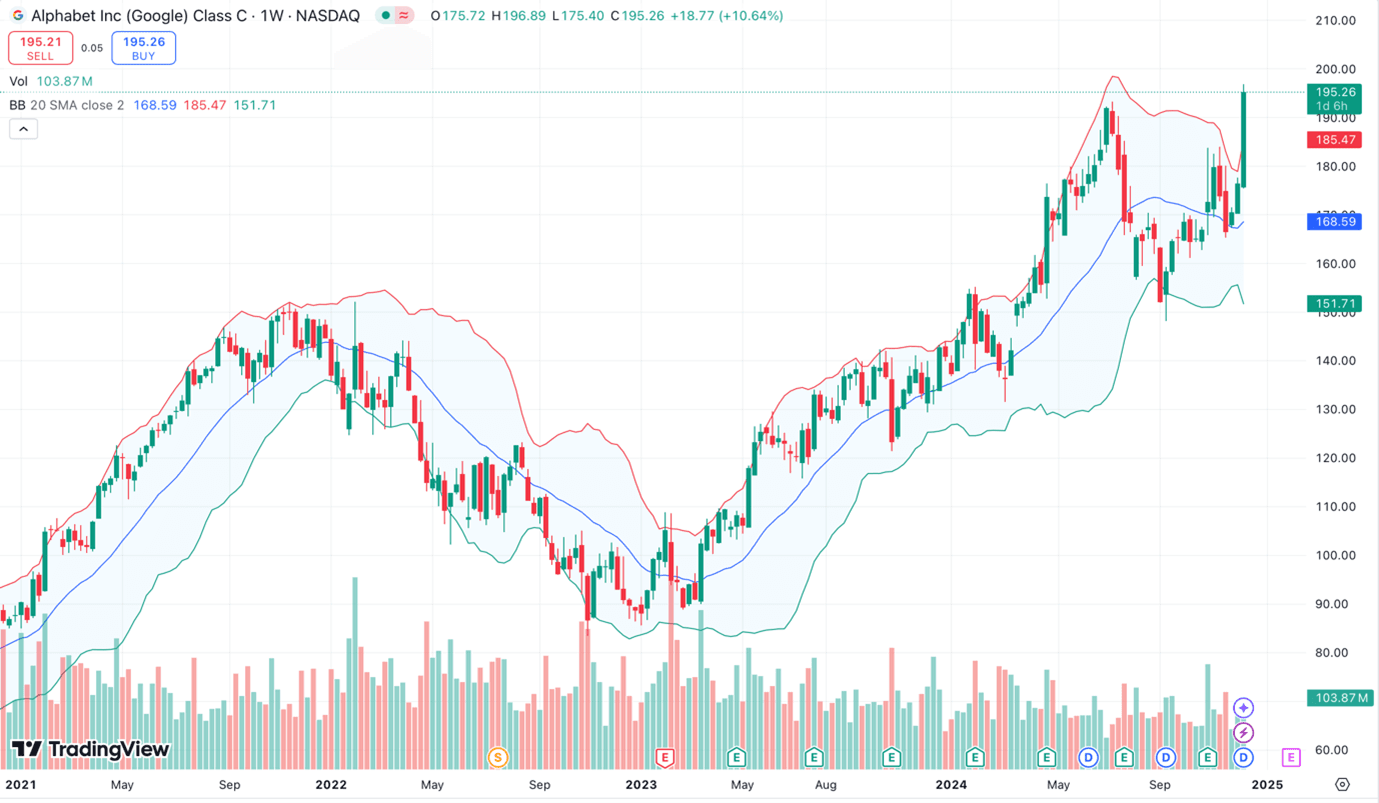
Bollinger Bands show the price and volatility of a financial instrument over time. The upper and lower Bollinger Bands are plotted at a standard deviation from a simple moving average of the instrument’s price. The bands widen when an instrument's price becomes more volatile and tighten when it is more stable.
Many traders consider an instrument to be overbought when its price approaches the upper band and oversold when it nears the lower band, helping them to establish potential exit and entry points for their trades.
5. Fibonacci retracement
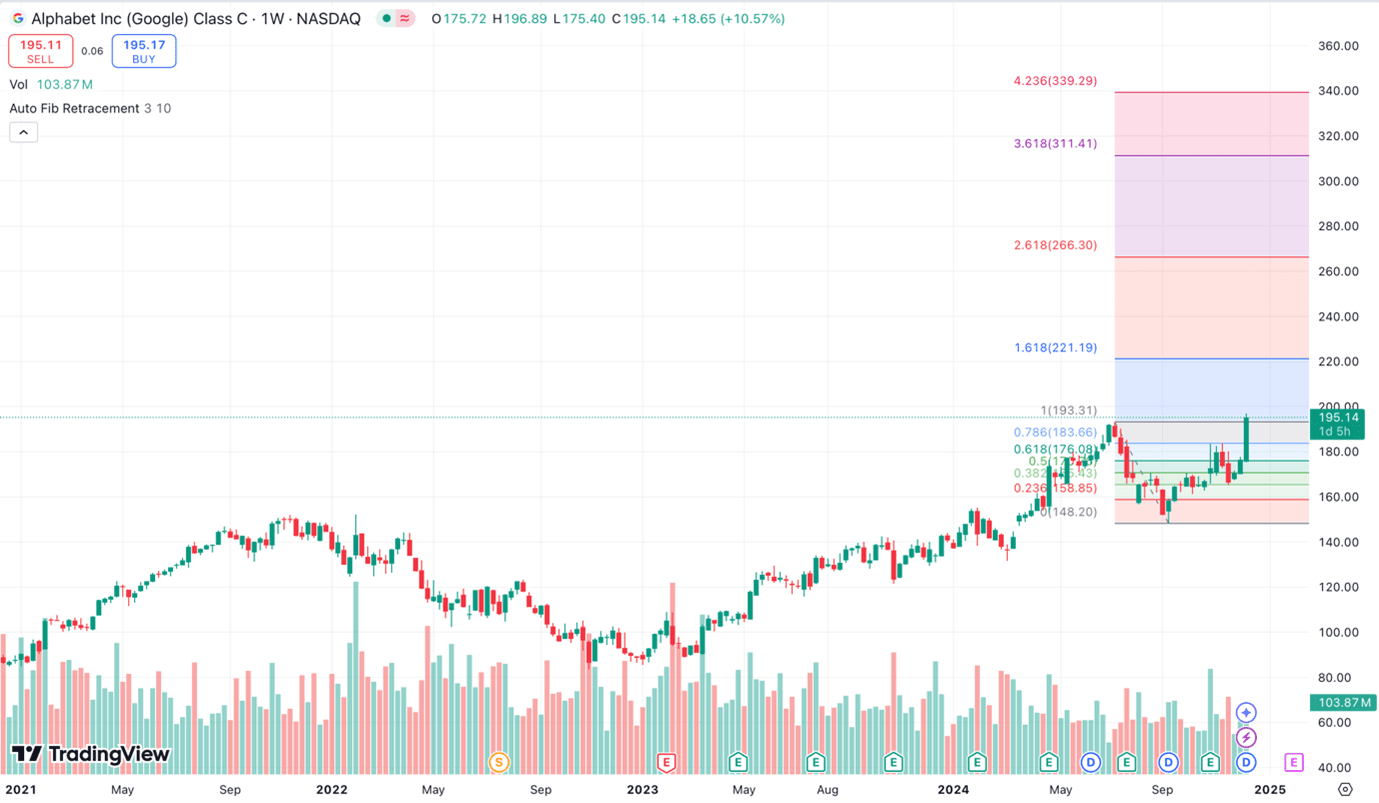
Fibonacci retracement is a technical analysis tool that highlights potential support and resistance levels within a market. The Fibonacci sequence is a series of numbers in which each number is equal to the sum of the preceding two numbers:
0, 1, 1, 2, 3, 5, 8, 13, 21, 34, 55, 89, 144, etc.
The sequence gives us the ratios that form the Fibonacci retracement levels used in trading: 23.6%, 38.2%, 61.8%, 78.6%, and so on. Although not part of the sequence, the 50% level is also often used.
Displayed as horizontal lines on a financial instrument’s price chart, Fibonacci retracements can help traders identify points where an instrument’s price might reverse or stall. Traders also use Fibonacci retracements to anticipate future price movements and to inform their thinking when adding stop-loss orders to their trades.
As with each indicator in this list, Fibonacci retracements are arguably most helpful when used in combination with other indicators.
6. Stochastic oscillator
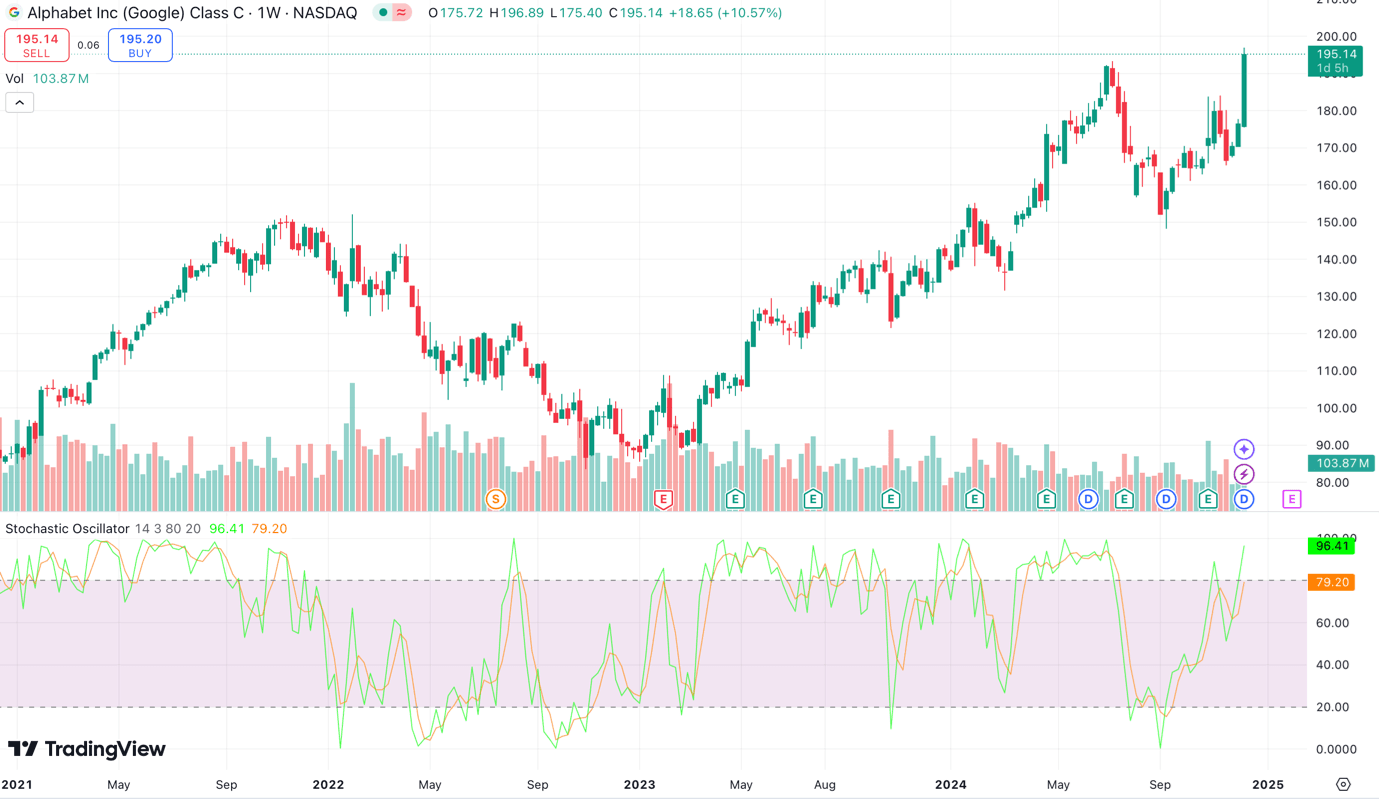
A stochastic oscillator is a momentum indicator that measures the relationship between a financial instrument’s closing price and its price range over a period of time. It can help traders assess whether an instrument is overbought or oversold.
On TradingView the stochastic oscillator appears below an instrument’s price chart as two lines, known as the K and D lines. The K line is the faster-moving line, with the D line showing the three-period moving average of the K line.
The stochastic oscillator represents recent prices on a scale of 0 to 100, with a reading above 80 indicating that an instrument is near the top of its range and may be overbought, while a reading below 20 signals that an instrument is near the bottom of its range and may be oversold.
7. Volume profile
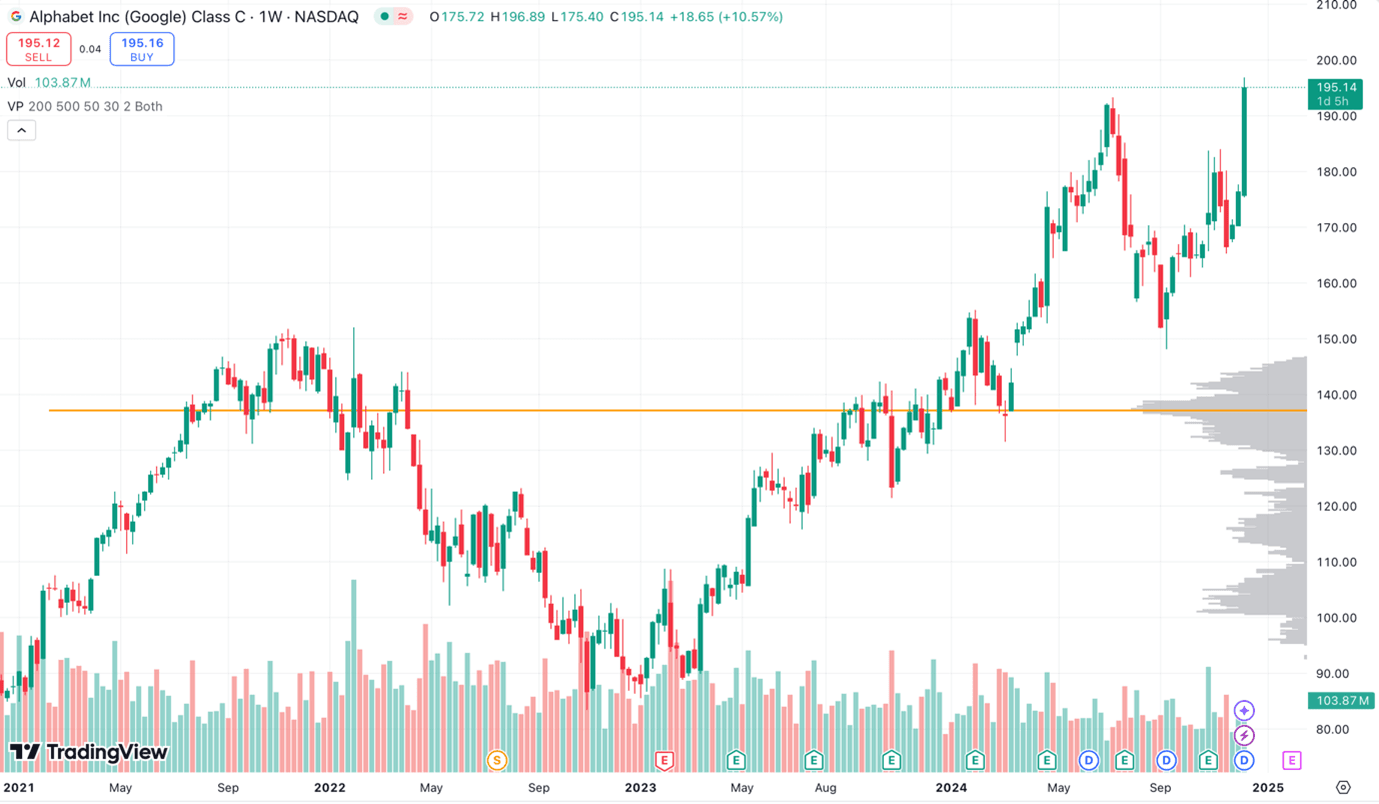
The volume profile shows the number of trades on a financial instrument at various price levels over a specific period. Displayed as a horizontal histogram, each bar represents the volume of trades at a given price point.
While traditional volume indicators show trade volume over hours, days or months, volume profiles offer a more nuanced view of trading activity at every price point.
Traders can use these profiles alongside other indicators to highlight support and resistance levels, to confirm trends and to plan their trades.

Ready to get started?
Start trading with a live account today or try a demo with $10,000 of virtual funds.