Julius de Kempenaer is the creator of relative rotation graphs (RRGs), as well as being the co-founder and director of RRG Research. In this excerpt from his latest article for Stockcharts.com, Julius explores two sectors worth considering in April.

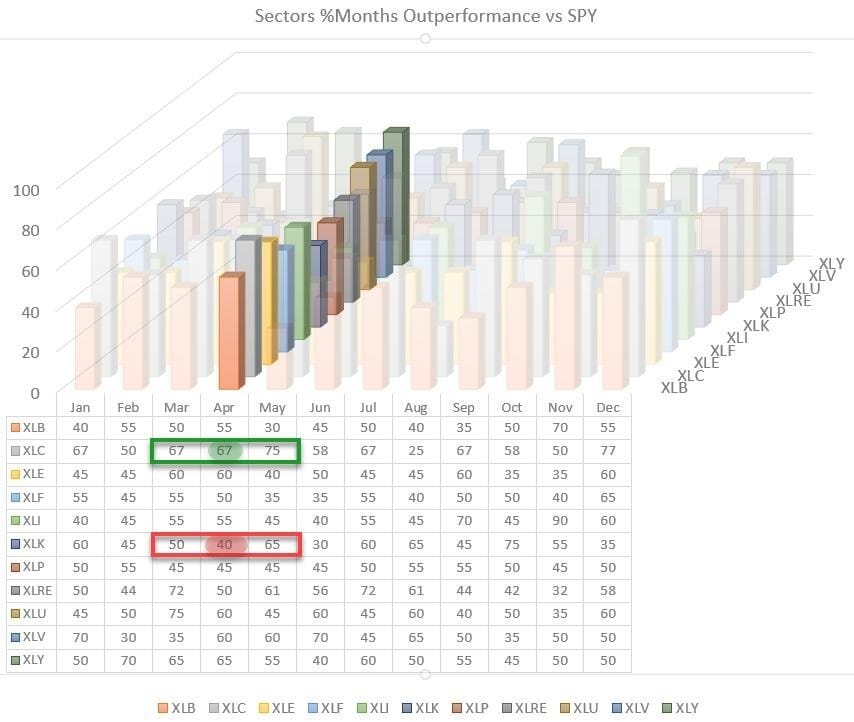
The seasonal trends for sectors versus the S&P 500 going into April show many 50/50 odds for out- or underperformance. But the two sectors that stand out are interesting and important ones.
Seasonality for communication services shows that this sector outperformed 67% of the time in April and 75% in May. So, based on this seasonal trend, a good period for Communication Services may be expected.
Information Technology, on the other hand, shows outperformance 40% of the time, or, in other words, an underperformance 60% of the time.
What magnitude of over-/underperformance can be expected?
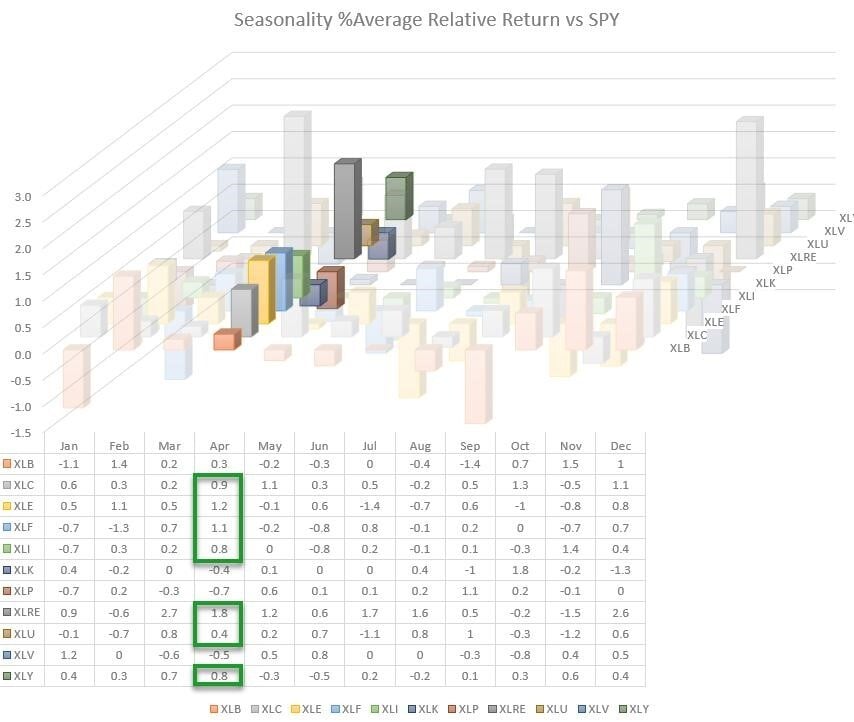
The table below shows the average relative return per sector versus the S&P 500.

For the Communication Services Select Sector SPDR Fund [XLC], that is an average of 0.9% outperformance over the SPDR S&P 500 ETF Trust [SPY]. For the Technology Select Sector SPDR Fund [XLK], that is a 0.4% underperformance versus SPY, which is in line with the figures from the first table.
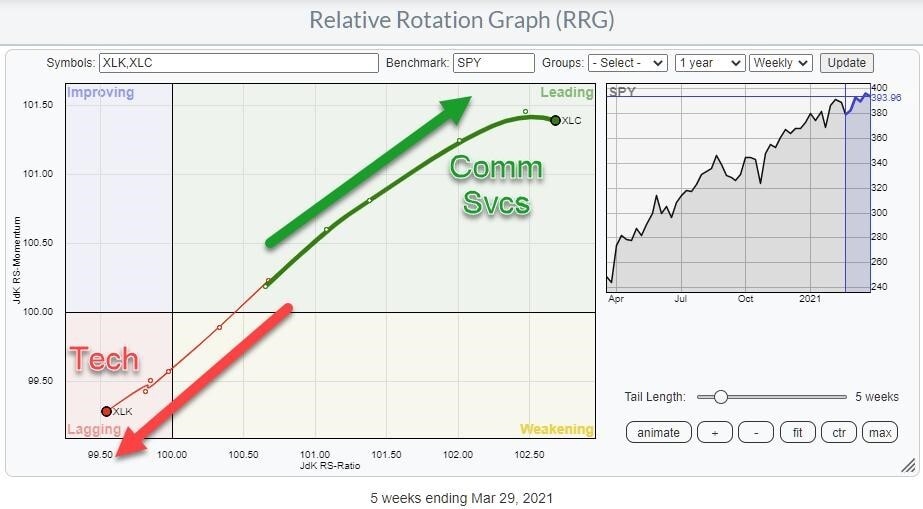
Now how are these sectors currently rotating on the RRG?

The RRG above shows the rotation for XLC and XLK versus SPY over the last five weeks. The pattern could not be more clear. XLC is moving further into the leading quadrant, while XLK is pushing into lagging.
This rotation fully matches the seasonal expectations for these sectors.
For the full article, which includes a more detailed breakdown of the XLC and XLK, head over to Stockcharts.com, here.
Disclaimer Past performance is not a reliable indicator of future results.
CMC Markets is an execution-only service provider. The material (whether or not it states any opinions) is for general information purposes only, and does not take into account your personal circumstances or objectives. Nothing in this material is (or should be considered to be) financial, investment or other advice on which reliance should be placed. No opinion given in the material constitutes a recommendation by CMC Markets or the author that any particular investment, security, transaction or investment strategy is suitable for any specific person.
The material has not been prepared in accordance with legal requirements designed to promote the independence of investment research. Although we are not specifically prevented from dealing before providing this material, we do not seek to take advantage of the material prior to its dissemination.
CMC Markets does not endorse or offer opinion on the trading strategies used by the author. Their trading strategies do not guarantee any return and CMC Markets shall not be held responsible for any loss that you may incur, either directly or indirectly, arising from any investment based on any information contained herein.
*Tax treatment depends on individual circumstances and can change or may differ in a jurisdiction other than the UK.
Continue reading for FREE
- Includes free newsletter updates, unsubscribe anytime. Privacy policy


