Q4 was characterized by some nervous market moves. (Relative) Momentum based strategies generally don’t like that type of behaviour.
The table below shows the 90-day, and 30-day performance for all baskets as of Dec 16:
BASKET Name | 90-day perf BASKET | 90-day perf BENCHMARK | +/- PERF | 30-day perf BASKET | 30-day perf BENCHMARK | +/- PERF |
UK 350 | 1.6% | 2.6% | -1.0% | -0.9% | -1.4% | 0.5% |
SPX 500 | -0.7% | 5.8% | -6.5% | -1.6% | 1.2% | -2.8% |
NDAQ 100 | -1.4% | 5.8% | -7.2% | -1.8% | 1.2% | -3.0% |
Australia 200 | -0.5% | -1.5% | 1.0% | 3.4% | -1.4% | 4.8% |
US Growth 1000 | -9.3% | 5.2% | -14.5% | -6.5% | 0.3% | -6.8% |
Hong-Kong Large-Cap | -6.3% | -5.7% | 0.6% | -0.3% | -7.1% | 6.8% |
Germany Large 110 | 3.1% | 0.4% | 2.7% | 1.3% | -2.4% | 3.7% |
Especially the US based baskets took a beating with clear underperformance over a 90-day period. The UK came in just shy of its benchmark while Australia, Hong Kong, and especially the German basket managed to outperform.
The good news is that all baskets started to pick up and recover over the last 30-days.
UK
The UK basket managed to keep up with the benchmark after a dip at the start of the quarter. At the rebalancing moment for Q1-2022, the ten stocks that surfaced for inclusion in the new UK basket is shown on the Relative Rotation graph (RRG), below.
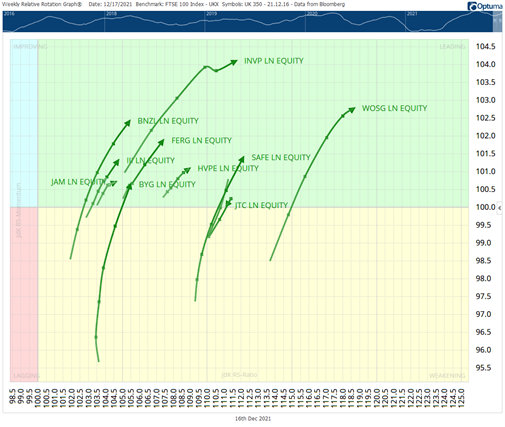
It’s interesting to see that for the coming quarter, two investment funds made it to the top ten of this universe - The JP Morgan American Investment Trust Plc and the HarbourVest Global Private Equity Ltd.
Then there are three stocks from the Financial sector: Investec, JTC, and 3i group; two Real Estate stocks: Safestore Holdings and Big Yellow Group; Two stocks from Industrials; Ferguson and Bunzl; and finally, one name from the Consumer Discretionary sector: Watches of Switzerland.
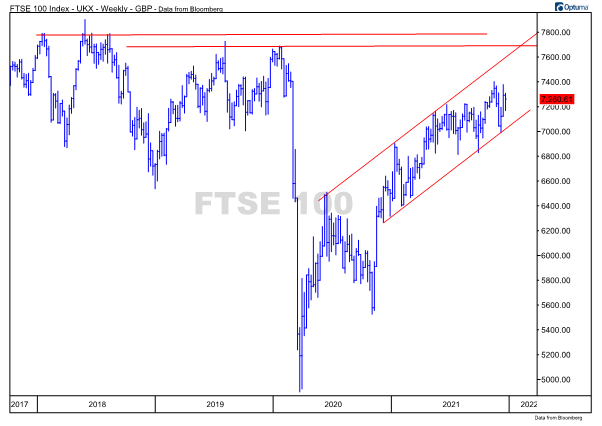
The FTSE 100 index, which is the benchmark for this basket, is still working its way higher inside the boundaries of a rising channel that started to take shape at the start of 2021.
Major resistance is only expected between 7700-7800 for this market. This is where major market peaks were formed during the course of 2018 and 2019. For the time being the outlook for the UK market remains positive.
One of the interesting stocks from a technical perspective is Bunzl:
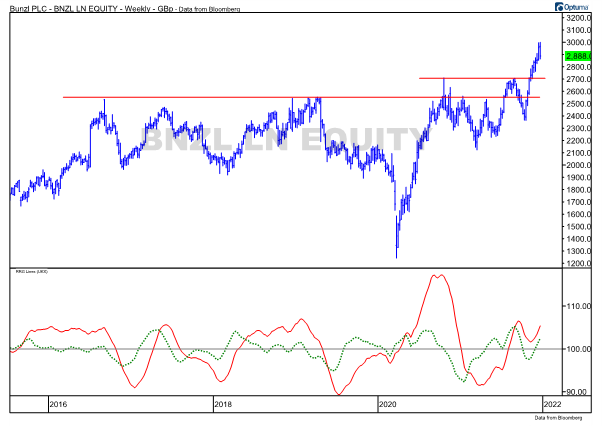
This stock recently managed to break to new highs after having spent almost six years trying to break above overhead resistance between 2500-2600, and more recently 2700. This break opened up the way for much more upside potential and it could become a strong contributor to the RRG basket in Q1-2022.
The red and green lines below the price chart are the Jdk RS-Ratio and JdK RS-Momentum lines, which are plotted on the horizontal and vertical axes of the RRG.
Germany
The Germany Large 110 RRG Momentum+ share basket was the best performing product in Q4 of 2021. Going into Q1-2022 the basket holds stocks from six sectors and is therefore well spread without one sector being very dominant.
The members of the RRG Germany Large 110 basket are:
Consumer Discretionary: Puma SE
Health Care: Siemens Healthineers AG, Qiagen NV, Merck KGaA
Industrials: GEA group AG, KION Group AG
Information Technology: Jenoptik AG, Cancom SE
Materials: Linde Plc
Utilities: RWE AG
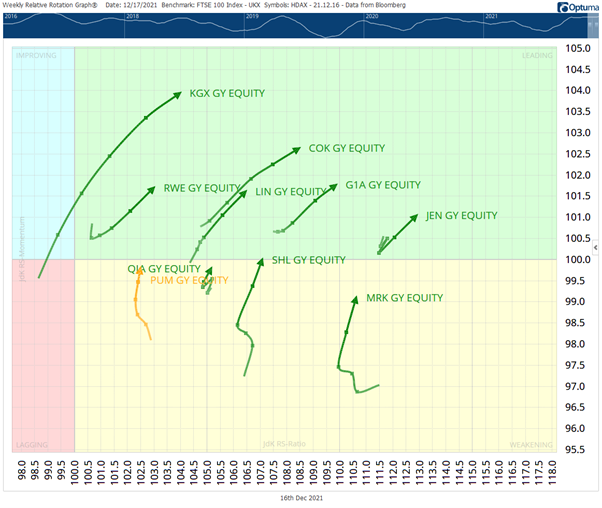
On the RRG, you can see that some stocks are still inside the ‘weakening’ quadrant but moving upward on the Jdk RS-Momentum scale and close to crossing back into the leading quadrant. This type of rotation occurs when a stock is in a (strong) relative uptrend and went through a setback/pause. That setback, however, was not strong enough to pull the rotation all the way into the lagging quadrant. The move back up towards and into the leading quadrant signals that these stocks are about to start a new leg up, within an already established relative trend.
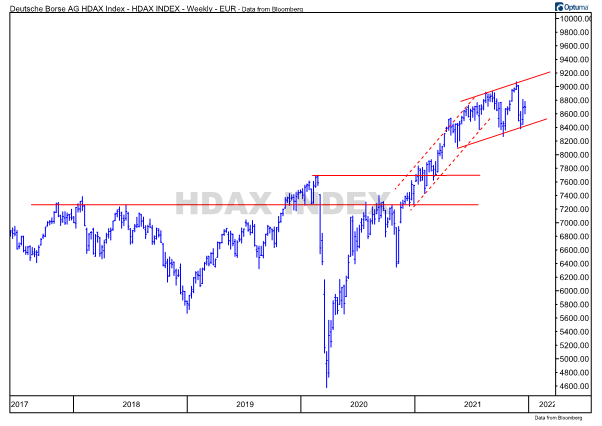
The chart for the HDAX index, a composite index that includes large-, mid-, and small-cap stocks shows a break higher at the start of 2021 after which this market rallied higher in a relatively steep channel.
The Rate of Change of that rally started to slow down halfway through the year and is now establishing a new channel at a slope that is less steep. However, the trend is still upward.
One of the stocks in the new basket is Cancom SE:
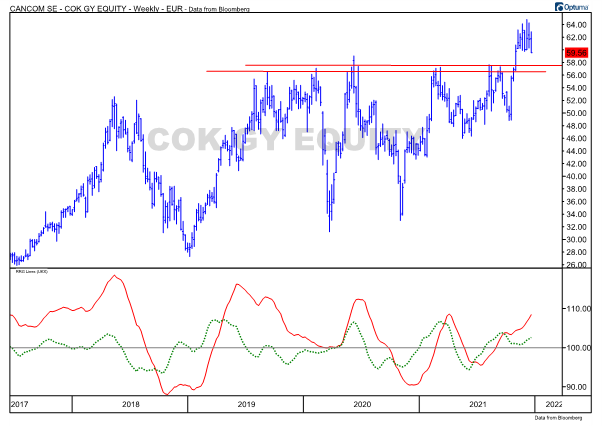
After a period of very wide swings from 2018-2021, this stock has recently managed to break above heavy overhead resistance that opened up a lot of fresh upward potential while the former breakout level near EUR 57-58 should now start to act as support in case of a setback.
The RRG-Lines below the chart are both above 100 and rising, which is pushing Cancom further into the leading quadrant, suggesting that further outperformance might be possible.
Disclaimer Past performance is not a reliable indicator of future results.
CMC Markets is an execution-only service provider. The material (whether or not it states any opinions) is for general information purposes only, and does not take into account your personal circumstances or objectives. Nothing in this material is (or should be considered to be) financial, investment or other advice on which reliance should be placed. No opinion given in the material constitutes a recommendation by CMC Markets or the author that any particular investment, security, transaction or investment strategy is suitable for any specific person.
The material has not been prepared in accordance with legal requirements designed to promote the independence of investment research. Although we are not specifically prevented from dealing before providing this material, we do not seek to take advantage of the material prior to its dissemination.
CMC Markets does not endorse or offer opinion on the trading strategies used by the author. Their trading strategies do not guarantee any return and CMC Markets shall not be held responsible for any loss that you may incur, either directly or indirectly, arising from any investment based on any information contained herein.
*Tax treatment depends on individual circumstances and can change or may differ in a jurisdiction other than the UK.
Continue reading for FREE
- Includes free newsletter updates, unsubscribe anytime. Privacy policy

