In this article, Forrest Crist-Ruiz, assistant director of trading research and education at MarketGauge.com, provides an overview of the key sectors and ETFs that provide a more holistic view of the market’s overall health.
Although every member of the economic modern family closed down on Monday, none broke their major support areas.
Here is a quick rundown of where each member’s closest support level is.

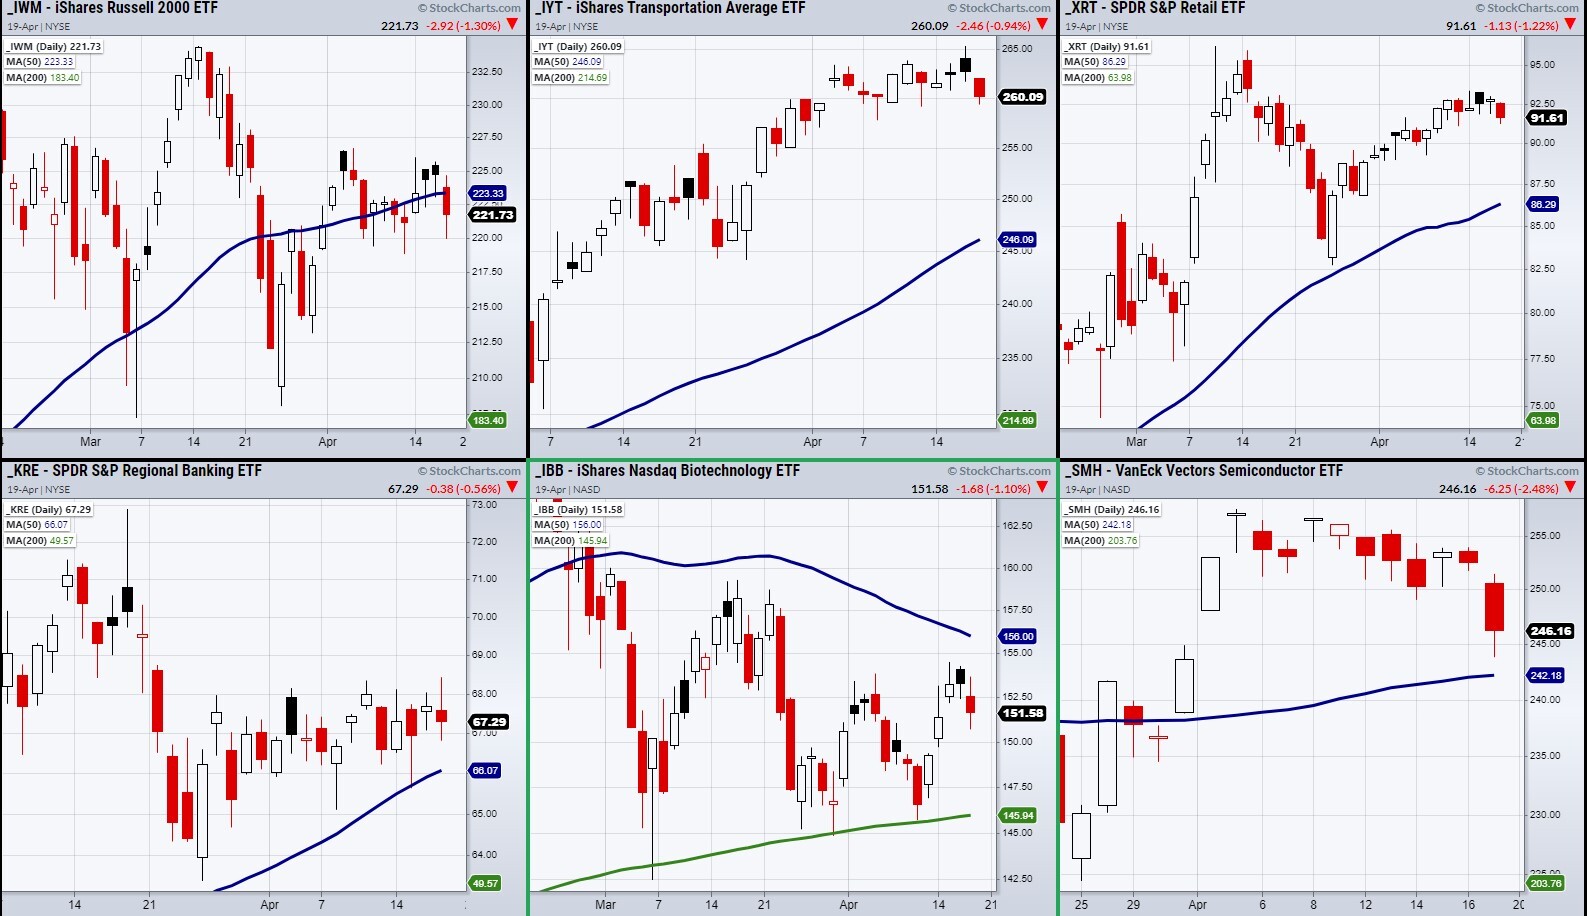
First, we have the iShares Russell 2000 ETF [IWM], with support from the low of its current range at $218.83. This low was created on 13 April.
The iShares Transportation Average ETF [IYT] has support at $255.39 from 22 March. The prior high now serves as a minor support level.
The SPDR S&P Retail ETF [XRT], the VanEck Vectors Semiconductors ETF [SMH] and the SPDR S&P Regional Banking ETF [KRE] all have support from their 50-day moving averages (DMAs) — XRT at $86.29, SMH at $242.18, and KRE $66.07.
One thing to note is how the banking and retail sectors have not closed underneath their 50-DMAs this year, which makes the price level of their moving averages more meaningful.
The iShares Nasdaq Biotechnology ETF [IBB] has tested support from the 200-DMA multiple times, giving it a stronger support level at $145.94.
These five key sectors and single index create the economic modern family, which was created to boil down the overall market picture.
Additionally, by keeping track of their pivotal price levels, we can better time our trade entries and identify which sectors are leading or causing strain on the market.
This article was originally published on MarketGauge. With over 100 years of combined market experience, MarketGauge's experts provide strategic information to help you achieve your investing goals.
Disclaimer Past performance is not a reliable indicator of future results.
CMC Markets is an execution-only service provider. The material (whether or not it states any opinions) is for general information purposes only, and does not take into account your personal circumstances or objectives. Nothing in this material is (or should be considered to be) financial, investment or other advice on which reliance should be placed. No opinion given in the material constitutes a recommendation by CMC Markets or the author that any particular investment, security, transaction or investment strategy is suitable for any specific person.
The material has not been prepared in accordance with legal requirements designed to promote the independence of investment research. Although we are not specifically prevented from dealing before providing this material, we do not seek to take advantage of the material prior to its dissemination.
CMC Markets does not endorse or offer opinion on the trading strategies used by the author. Their trading strategies do not guarantee any return and CMC Markets shall not be held responsible for any loss that you may incur, either directly or indirectly, arising from any investment based on any information contained herein.
*Tax treatment depends on individual circumstances and can change or may differ in a jurisdiction other than the UK.
Continue reading for FREE
- Includes free newsletter updates, unsubscribe anytime. Privacy policy


