Spread bets and CFDs are complex instruments and come with a high risk of losing money rapidly due to leverage. 69% of retail investor accounts lose money when spread betting and/or trading CFDs with this provider. You should consider whether you understand how spread bets and CFDs work and whether you can afford to take the high risk of losing your money.

Ichimoku Cloud

Ichimoku Cloud, also known as Ichimoku Kinkō Hyō, is a type of technical trading indicator​. Unless you have an understanding of Japanese, the terms Kijun, Tenkan, Senkou, Kumo, Chikou will seem rather obscure. However, they actually refer to one of the most popular trading systems: the Ichimoku system.

Ichimoku Cloud is a trading system that was developed by Japanese journalist Goichi Hosada in the 1930s, and published in the 1960s. The literal translation of Ichimoku Kinkō Hyō means "equilibrium chart at a glance". It defines support and resistance​​, identifies trend direction and gauges momentum. Investors and traders can therefore identify the trend and look for potential trading signals. A bullish crossing of one of the Ichimoku levels indicates a buy signal, while a bearish crossing indicates a sell signal.

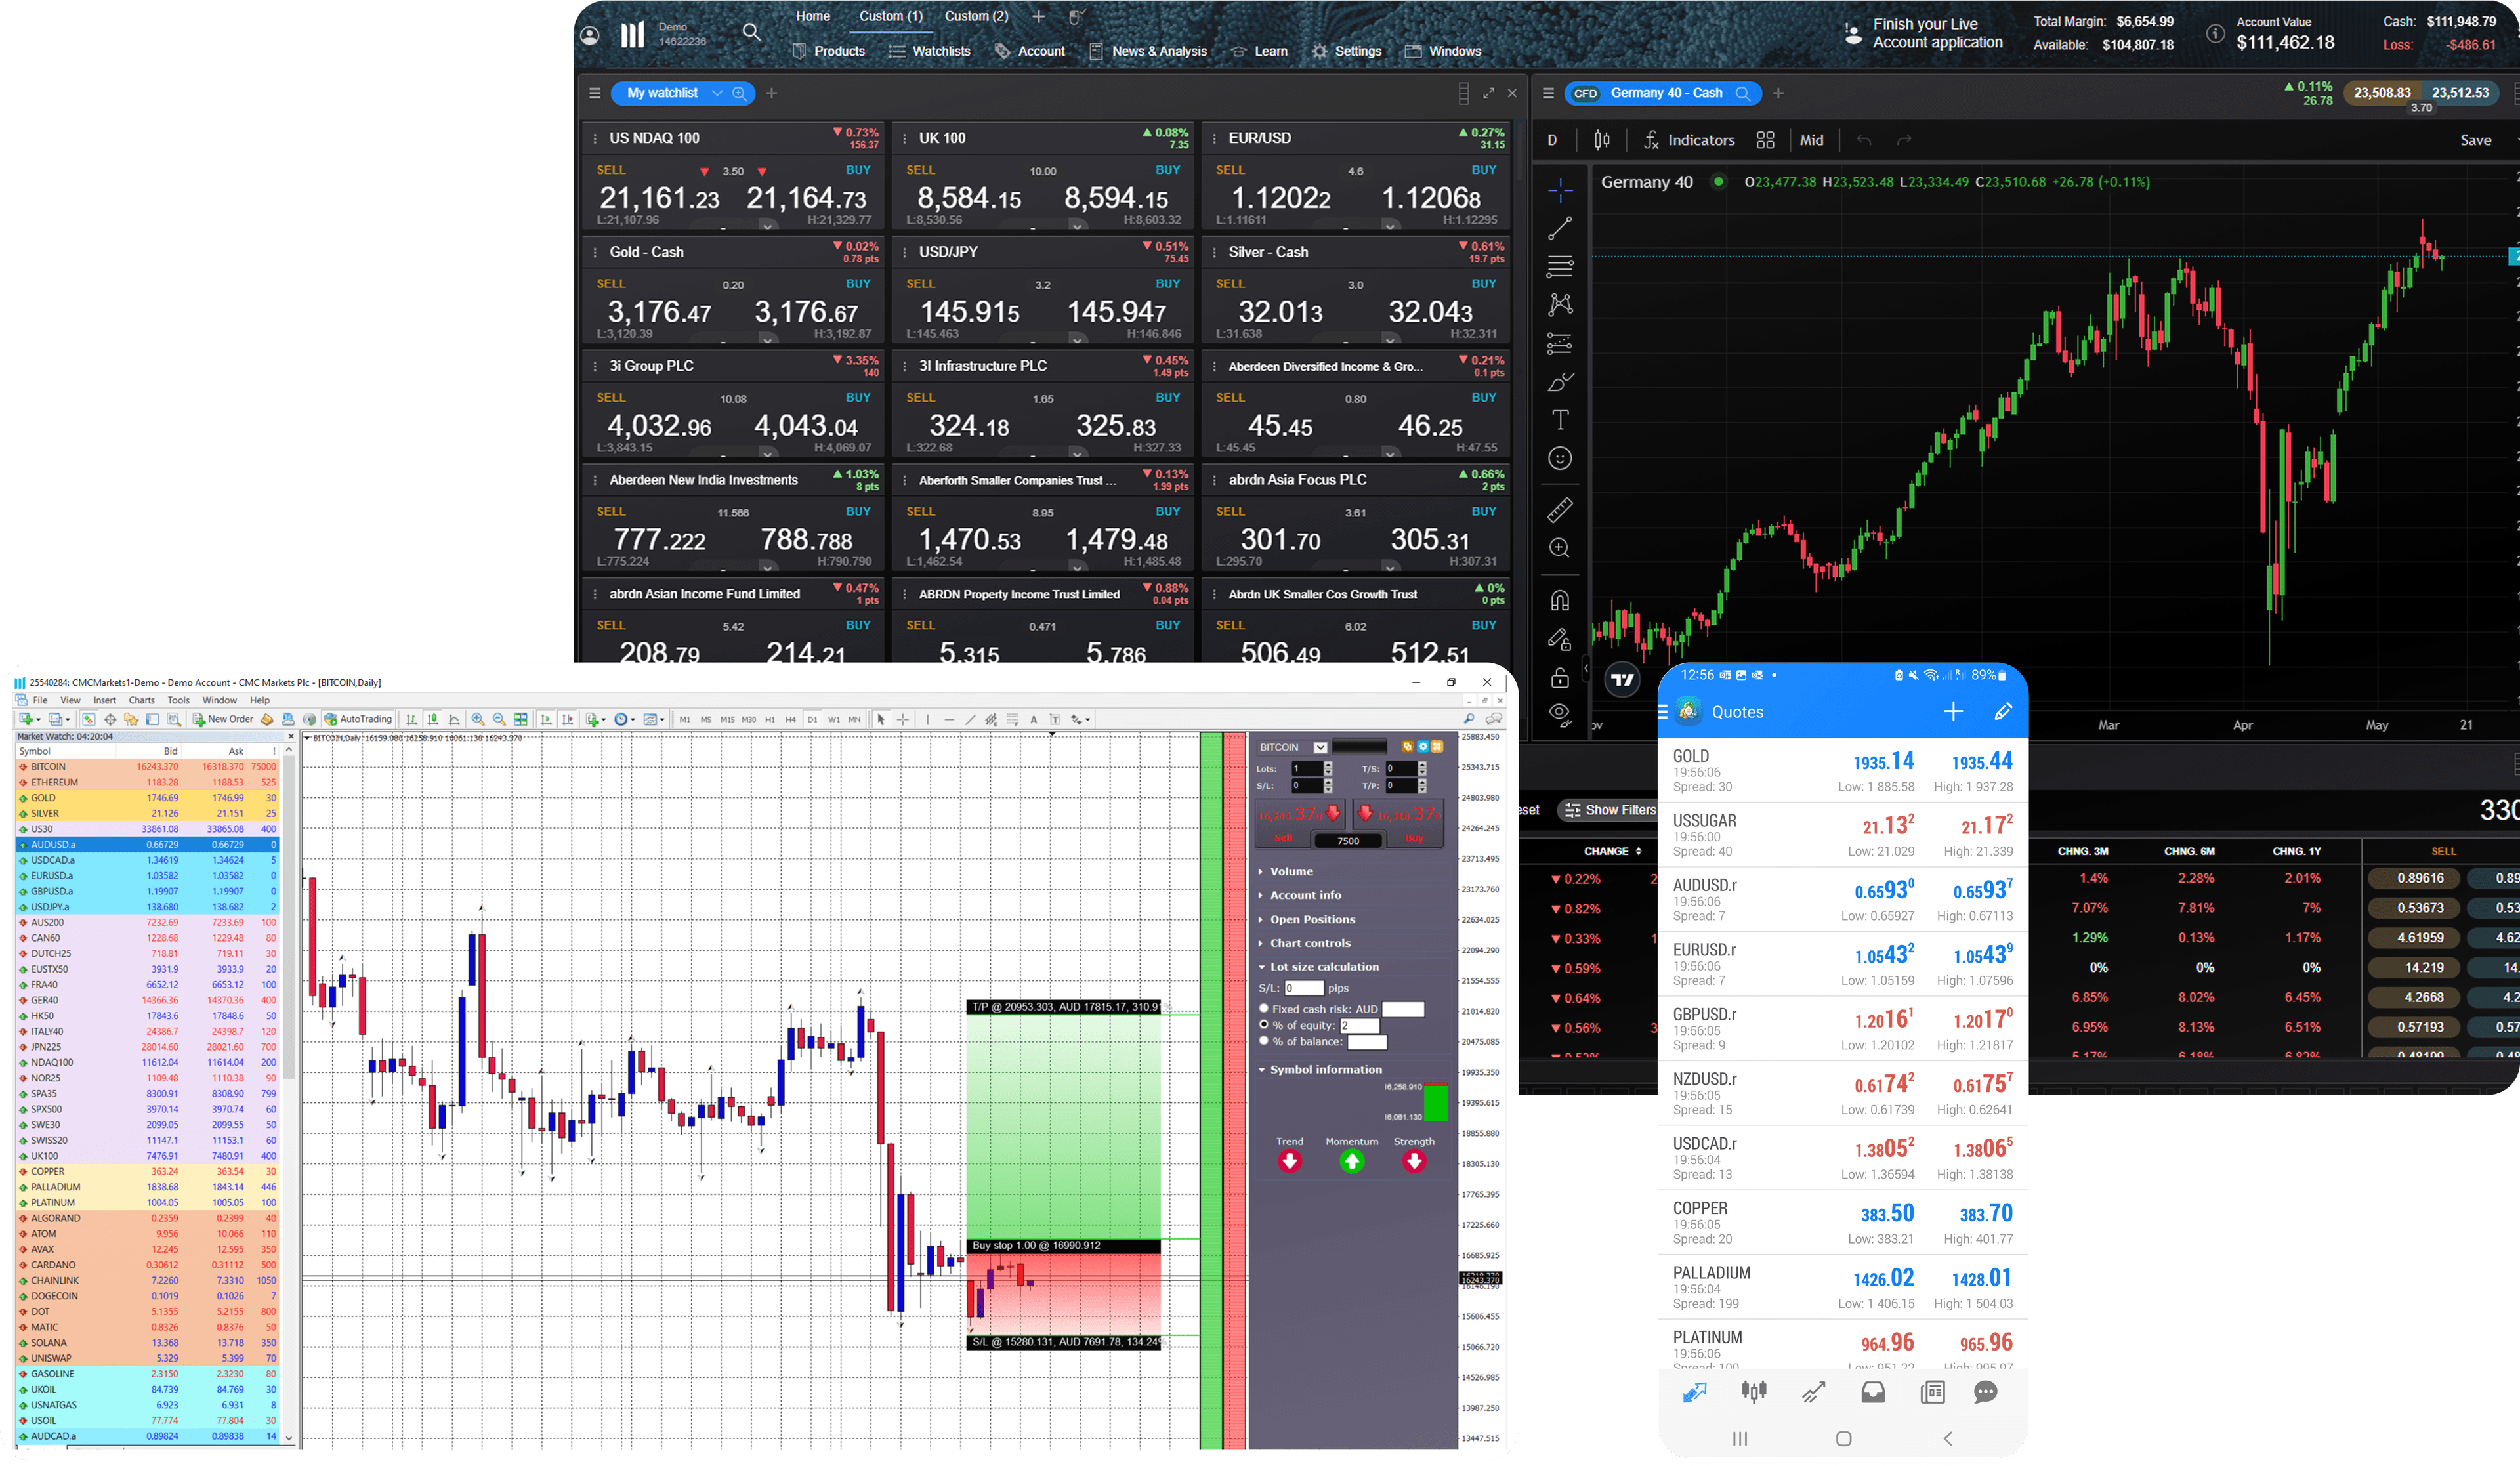
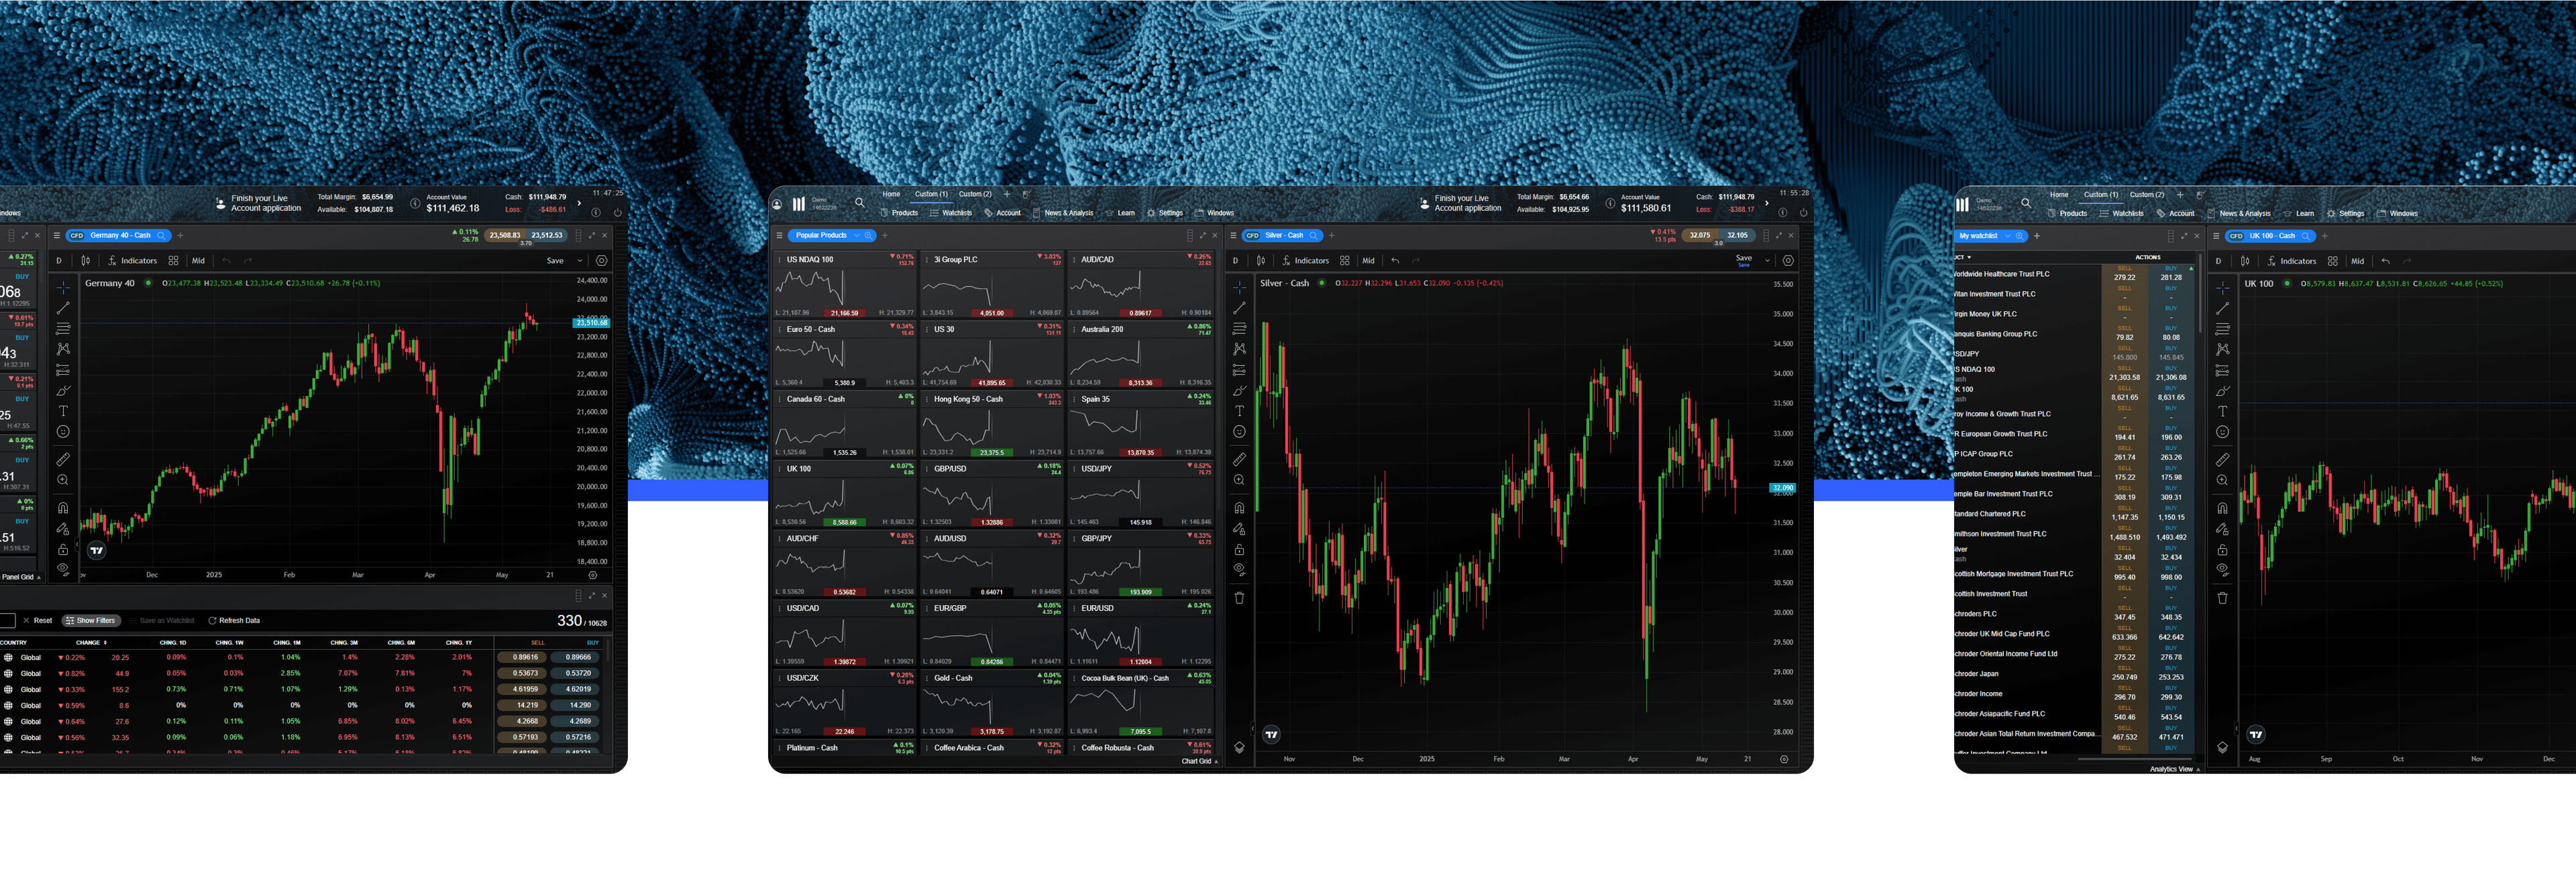
See inside our platform

Get tight spreads, no hidden fees and access to 12,000+ instruments.

Ichimoku in trading

Ichimoku Cloud is an important feature of technical analysis​ in trading and is primarily used to identify buy and sells signals. This method builds on candlestick charting​ to improve the accuracy of forecast price moves. The Ichimoku indicator is a moving average-based trend indicator system and usually contains more data than a candlestick chart, providing a clear picture of potential price action because it takes into consideration additional elements such as time and price trend.

Several elements make up the Ichimoku Cloud. Precisely, Ichimoku is a group of five indicators collectively used as a trend following indicator. These key components are:

  • Kijun Sen
  • Tenkan Sen
  • Senkou
  • Chikou
  • Kumo

Ichimoku formula

The lines in the Ichimoku indicator are calculated based on this formula:

Base line in Ichimoku

Kijun sen

Kijun sen is known as the base line in the Ichimoku indicator. The Kijun line is similar to the slow moving average line, as it shows longer term trends, but can have false calls on trend change. It is a median, usually calculated on 26 time periods.

Tenkan sen

The Tenkan line, also called the fast moving average line, shows short term trends, but can also have false calls on trend change. Tenkan is also a median and is usually calculated on 9 time periods.

Senkou A Span

Senkou span A forms the faster part of the cloud boundary, predicts future support boundary and is considered highly accurate until trends change. Senkou A corresponds to the average of Kijun and Tenkan, projected 26 time periods in the future.

Senkou B Span

The Senkou span forms the slower part of the cloud boundary, predicts future support boundary and is highly accurate until the trend changes. Senkou B corresponds to the median of the last 52 time periods, also projected 26 periods in the future.

Chikou

Chikou is simply the price plotted 26 time periods in the past.

Kumo (cloud)

Kumo is the space or shaded area between Senkou Span A and B. The thicker the cloud, the stronger support and resistance is. Kumo is the most distinctive feature of Ichimoku, and it gets its name from its unique appearance. If the price is above the cloud, the overall trend is bullish; if the price is below the cloud, the overall trend is bearish. Traders often look for Kumo Twists in future clouds, where Senkou Spans A and B exchange positions, which is a signal of potential trend reversals​.

To sum up, Chikou represents the market’s past, Kijun and Tenkan its present, and Kumo aims to represent its future.

How to trade Ichimoku

  1. Open an account to get started. You will automatically gain access to a free demo account, where you can practise trading with virtual funds.
  2. Choose your product and come up with a trading strategy. Define your entry and exit points.
  3. Brush up your knowledge of technical analysis. Our range of trading tools​ are not limited to technical indicators, but include draw tools, a chart pattern scanner and price projection tools.
  4. Use risk-management controls. Stop-loss orders​ and take-profit orders are good examples of how to curb a losing trade.

Although the Ichimoku Cloud is a versatile and complete indicator that provides information about support, resistance, trend direction and momentum all at the same time, traders should not solely rely on this. You could use Ichimoku together with other technical indicators and theories such as Elliott Wave, Dow, the Gann indicator and Fibonacci retracements.

Ichimoku Cloud trading system

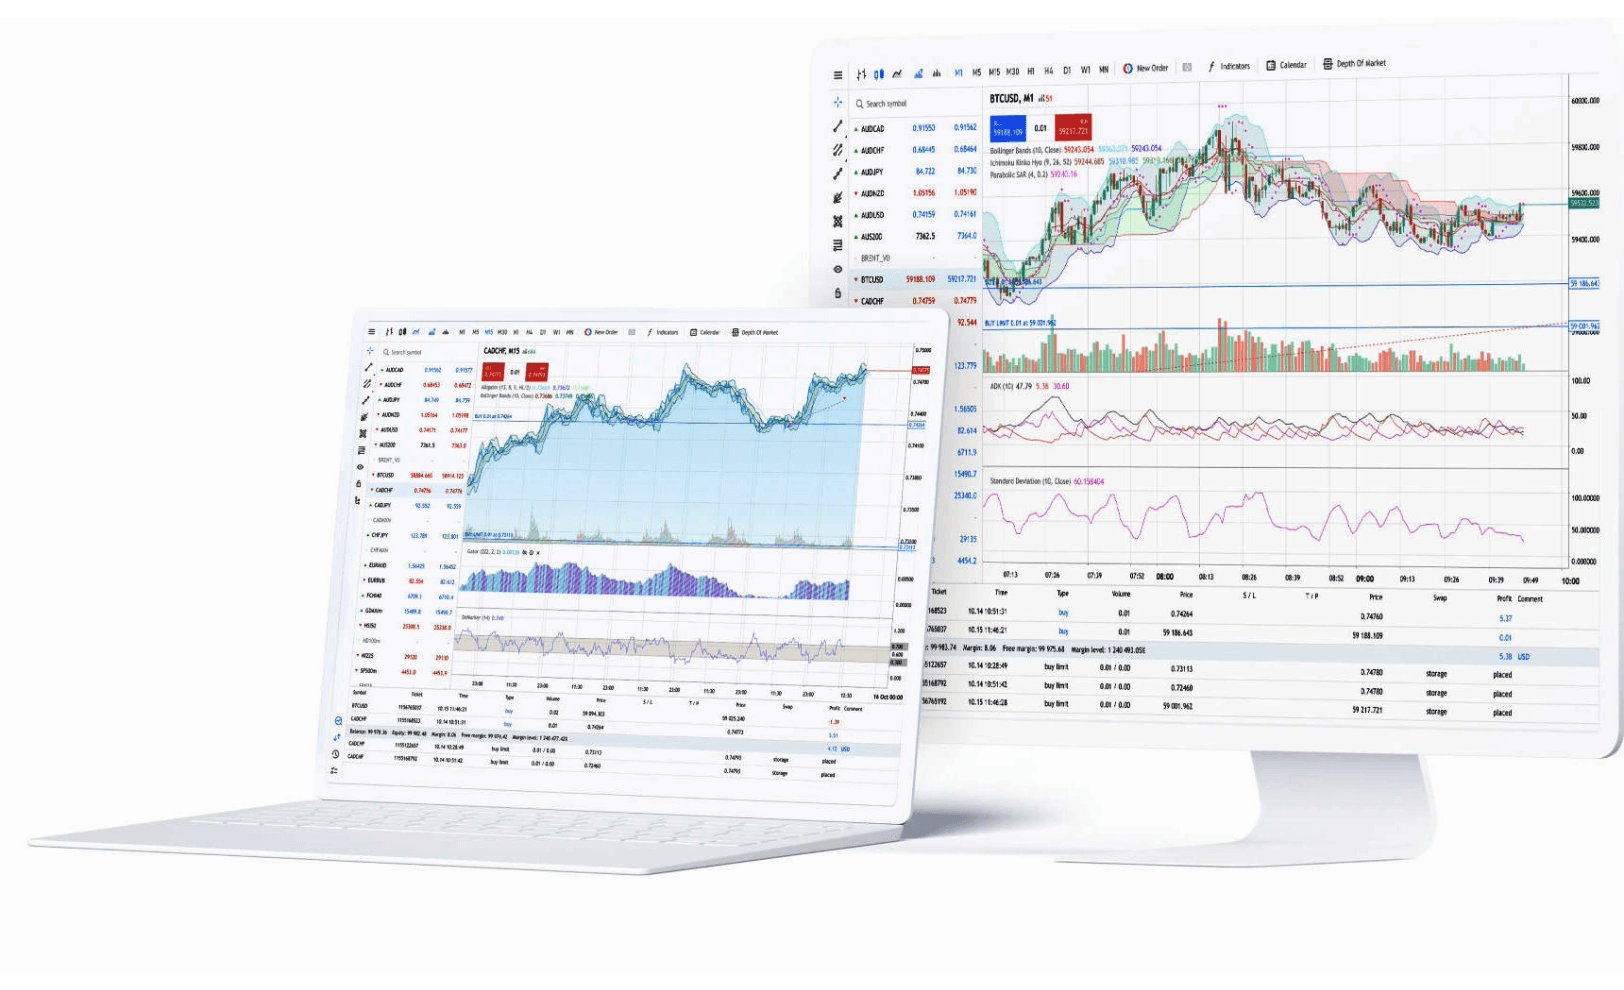
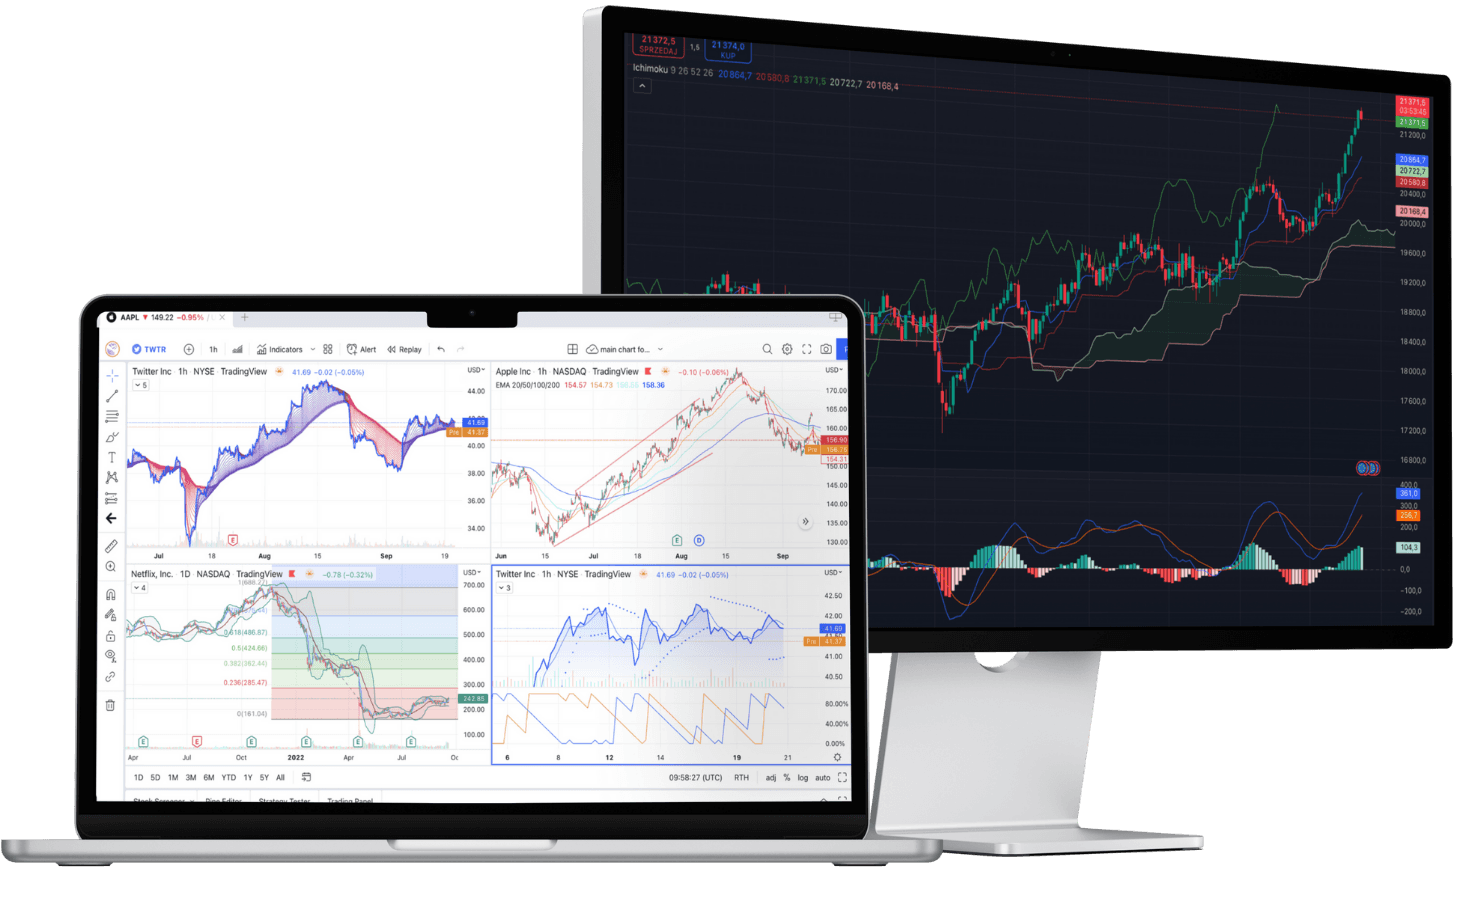
Users of the platform can access our Ichimoku Cloud indicator by registering for an account. After navigating the platform, you can start to use the indicator on trades such as forex and shares. Simply open a trading chart for your chosen instrument and click on the bottom bar called 'Technicals' to browse our wide range of technical overlays. You can combine Ichimoku with other indicators if you wish, and also apply draw tools such as support and resistance levels, trendlines and price projection boxes. Learn more about our Next Generation trading platform.

Ichimoku settings

To change the settings of Ichimoku Cloud, hover over the chart and click on the indicator's name where it pops up. You can change its parameters, such as the time period, amend the colours and styles of each line, and even combine it with additional indicators or fill spans.

Limitations of Ichimoku Cloud

The success of the Ichimoku trading system among investors could be attributed to its rather unfamiliar and intriguing nature, as so far, its performance is yet to be proven.

The indicators used by Ichimoku are somewhat complex compared to traditional technical indicators, but they work in the same way. Indeed, like any technical indicator, it is just a visual representation of information already included in the chart.

Why does the crossing of these price levels indicate a buy or a sell signal? It depends on the person. For some, it is simply a self-fulfilling prophecy or mere sheep-like behaviour among investors, but going from that to obtaining any real benefit from it, to anticipate price changes, once again, this is yet to be proven.

Hello, we noticed that you’re in the UK.

The content on this page is not intended for UK customers. Please visit our UK website.

Go to UK site