Volatility in options trading: strategies and insights
A volatile asset or market means a significant price swing is likely to follow – but it’s often difficult to predict whether the asset will soar or plummet. This article explains volatility in options trading, trading strategies and techniques based on volatility, and how you can learn to try and benefit from it.
What is volatility in options trading?
Volatility refers to the often significant and sudden variations in the price of an asset. A sharp rise or fall can be down to many factors, which can either be expected (such as a company’s anticipated earnings report) or take the market by surprise.
For example, a shocking news story about a company or its leaders has the potential to shake up markets. There are two distinct types of volatility:
Realised volatility (RV):
This measures how fast the price of the underlying asset has changed over time. Put simply, it’s a percentage calculated by working out its average price over a period of time, and how far and often it has deviated from that average. Realised volatility is sometimes also known as statistical or historical volatility.
Implied volatility (IV):
This is the market’s forecast of how far the price of an underlying asset will fluctuate in the future. It considers factors including the price of the underlying asset, the strike price of the option and the duration of the option contract. As the term ‘implied volatility’ suggests, it’s a measure of the volatility one might expect due to these factors. An option with higher implied volatility tends to cost more because of its potential to deliver significant returns, though it also raises the possibility of an option being out-of-the-money at its expiration.
Strategies for options trading in volatile markets
There are several established option volatility trading strategies. If implied volatility is high and traders expect it to decrease, they may enter short option positions. When implied volatility falls, the writer will benefit from the falling option price, allowing them to profit from closing the short position – at a lower price.
When volatility spikes, the value of options can soar significantly, benefiting buyers of options. They can sell long at a profit, since the option price would have risen. In this instance, an option seller/writer would suffer from having to buy back options at a higher price.
Popular option volatility strategies and techniques include the ‘straddle’ and the ‘strangle’.
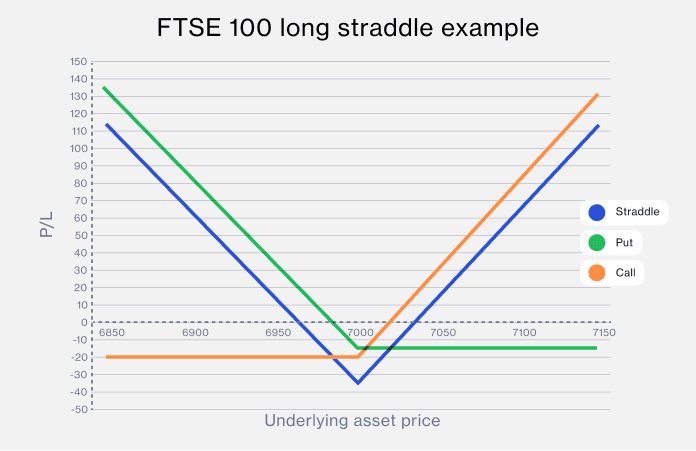
Long straddle
A straddle, as its name suggests, is a neutral options strategy that involves the trade of both a put and a call option on the same underlying asset, each with the same strike price and time until expiration.
This is potentially an attractive strategy for traders purchasing options in a volatile market because it has limited risk, with unlimited profit if the asset’s price moves dramatically, regardless of the direction.
There is a trade-off between choosing cheaper contracts that expire sooner and buying longer-dated contracts, which are more expensive but allow more time for the market to move.
Example
The FTSE 100 is trading at 7,000 points. You believe the index will move significantly, but are unsure in which direction. At-the-money call and put options (with a 7,000-point strike) are trading at £20 and £15 each, with each option representing 1 unit of the underlying asset.
You decide to buy one call (£20 x 1) and one put (£15 x 1), both with identical expiration dates. You’ve paid a total of £35.
The index jumps to 7,100 points at expiration, giving you a 100-point gain in your call option position. You exercise the call option and allow the put option to expire, which achieves a total return of £100. After subtracting the initial £35 cost, you've made a profit of £65.
Similarly, you also profit if the FTSE 100 falls to 6,900 points. In this scenario, the call option expires worthless, but the put option is in-the-money by 100 points – again, resulting in a return of £100 and, after deducting the £35 cost, a profit of £65.
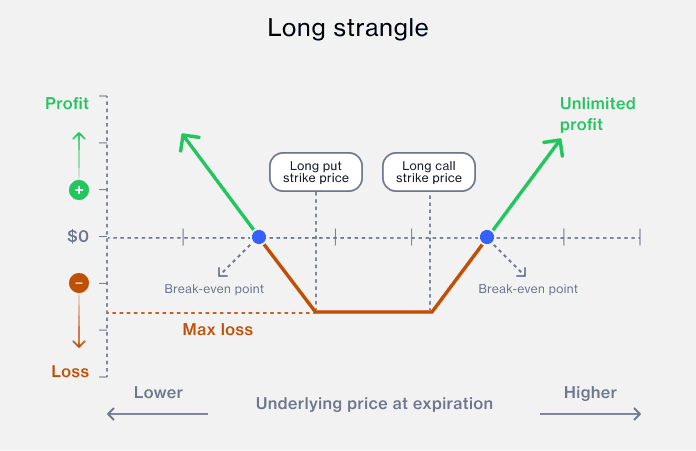
Strangle
A strangle differs from a straddle in two ways:
The trader simultaneously buys call and put options with the same expiry date but at different, out-of-the-money strike prices
The call strike price is higher than the price of the underlying asset, and the put strike price is lower
The cost, and therefore the maximum risk, is lower in comparison to a straddle, meaning you can trade in a larger size, or make more trades for your money.
The downside is that the two strike prices are further from the at-the-money price, which means there must be a larger move in the underlying asset before you begin to break even.
Example
The FTSE 100 is trading at 7,000 points. You decide to buy a call option with a strike price of 7,100 points. The price for the call option is £1.20 per point. Then you buy a put option, with a strike price of 6,900 points, at £0.80 per point.
Therefore, you have paid a total of £2 (£1.20 for the call option and £0.80 for the put option).
The potential profit is unlimited. However, the price had to climb significantly above the call strike price, or fall significantly below the put strike price, to make a profit. If the underlying price trades between the two strike prices at expiration, then your maximum loss would equal the £2 paid.
Risk-management techniques
As with any form of trading, the more volatile the market, the greater the risk, so it’s important to understand how to manage this when trading volatility with options.
If you own an asset, you can set a stop-loss order that takes effect when the price falls below a certain point (or, if you’re shorting stock, rises past a particular value). This figure is the amount you would be prepared to lose, and it makes sense when buying options to pay no more than that figure. However, most stop-loss orders don’t cover gapping, when the market opens at a different value from its previous close, without any trading taking place.
When buying options, it’s impossible to lose more than the option price, and by using straddle or strangle strategies with simultaneous call and put positions, you can potentially capitalise on various scenarios, even when a market is trading sideways. Sellers can, as previously mentioned, make a large profit when volatility is high, but they also face the risk of potentially unlimited losses from adverse movements in the underlying asset.
Tools and resources for analysing volatility
How do you know when the market, or an asset, is volatile? Essentially, you need to understand the forces driving the market, as well as the standard deviation: how much, on average, its value fluctuates away from the mean.
The very definition of volatility means it’s challenging to forecast accurately, but there are various indicators and calculations to help you determine the probability of fluctuation, as well as when and how volatile it’s likely to be. These include:
The average true range indicator (ATR)
The ATR calculates the true range of volatility of a given trading period (day, hour, minute, week) by taking the highest value of these three equations:
Current high minus previous close
- For day trading, this will be today's high to yesterday's closeCurrent low minus previous close
- For day trading, this will be today's low to yesterday's closeCurrent high minus the current low
- Today's high to today's low
This calculation is made several times over a chosen time to give you an average, which you can use as a baseline to calculate volatility. A higher ATR indicates greater price movement and volatility, which might lead to a higher options price.
Conversely, a lower ATR suggests less price volatility, potentially leading to a lower options price. Traders might use the ATR to gauge the potential risk and reward of a particular options trade, or to set stop-loss and take-profit levels.
Volatility Index (VIX)
This is a real-time index derived as a percentage using the pricing of S&P 500 index options. It’s a complex mathematical formula, but its headline figures give a snapshot of future expected volatility over the coming 30 days. It’s a tool used by investors to measure the level of fear or risk in the markets.
Bollinger Bands
This indicator consists of three lines on a graph indicating an asset’s upper value, lower value and moving average over a certain period, and is designed to show when assets are overbought or oversold. When the lines – or bands – narrow and 'squeeze' together, it’s a general indication that volatility is likely. When they move further apart, it indicates the market or asset price is stable.
There are several other indicators of volatility. It should be noted that no single tool is a reliable barometer of volatility, and trading decisions should be made by correlating with other tools and indicators.
Summary
Volatility options trading can realise a profit, in whichever direction an asset or market fluctuates. By selling options, it's possible to make a profit even if the underlying asset price doesn't move. This is because, as an options seller, you receive an amount equivalent to the number of contracts for OTC options (or the option price multiplied by the number of units staked with spread bet options), which is your maximum potential profit. If the asset's price doesn't move significantly, the option may expire worthless, allowing you to keep the entire amount.
Understanding the metrics of realised and implied volatility, and options-focused tools and indicators, is key to trading options in volatile markets. These metrics can help predict an asset's future price movements and volatility.
There are risks, particularly if you sell call and put options: if the market moves sharply against your short position, your potential loss is unlimited. It's therefore important to manage your risk when you're trading options.
Trading inevitably carries risk. However with options trading, if you buy a put and a call option on a volatile asset, you automatically limit any losses to the price of the option, while giving yourself the potential to make a profit. Traders who sell options can make a profit limited to the sold price of an option, but can suffer unlimited losses.
There are a number of important points to consider before you start trading on options volatility, including:
Undertake the required product and financial markets research
Develop an options trading strategy
Create an account and pass our options suitability test
Test-drive your options trading ideas in a risk-free environment with our demo account
The higher the implied volatility, the greater the likelihood the option will be in the money at its expiration. This likelihood is reflected in the options price.
Yes, one way to potentially take advantage of falling prices would be to buy a put option, or to sell a call option.
No. You can place call and put options at the same strike price through a strategy called a straddle, but you can potentially profit by buying a call and put at different strike prices, which is known as a strangle.
Straddles and strangles are just two methods of trading based on volatility expectations. There are many other ways traders can trade on volatility, or limit their risk to volatility, through options.


Ready to get started?
Any questions?
Email us atWe're available whenever the markets are open, from Sunday night through to Friday night.