At the start of 2021 the UK 350 RRG® Momentum+ basket held the following constituents.
WEIR, SYNT, AAF, OSB, CRST, FGP, VMUK, TIFS, NWG, MGGT

This composition resulted in a 15% gain for the quarter (17/12/20 – 17/03/21) against a 3% increase for the FTSE 100.
The Relative Rotation Graph (RRG) below shows the rotation for this basket during that period:
At the start of Q2 2021 our scan, again, showed over 100 possible candidates for inclusion. Ranking this group, as per our methodology, on their JdK RS-Ratio values, resulted in the following stocks selected for inclusion in the basket for Q2 2021:
AGK, RMG, IPO, KAZ, ENOG, CBG, AAL, VMUK, SMWH, TLW

This means that VMUK managed to remain in the top-ten which is a remarkable sign of strength. Based on our historical research, it is very uncommon that a stock remains in the basket for two successive quarters.
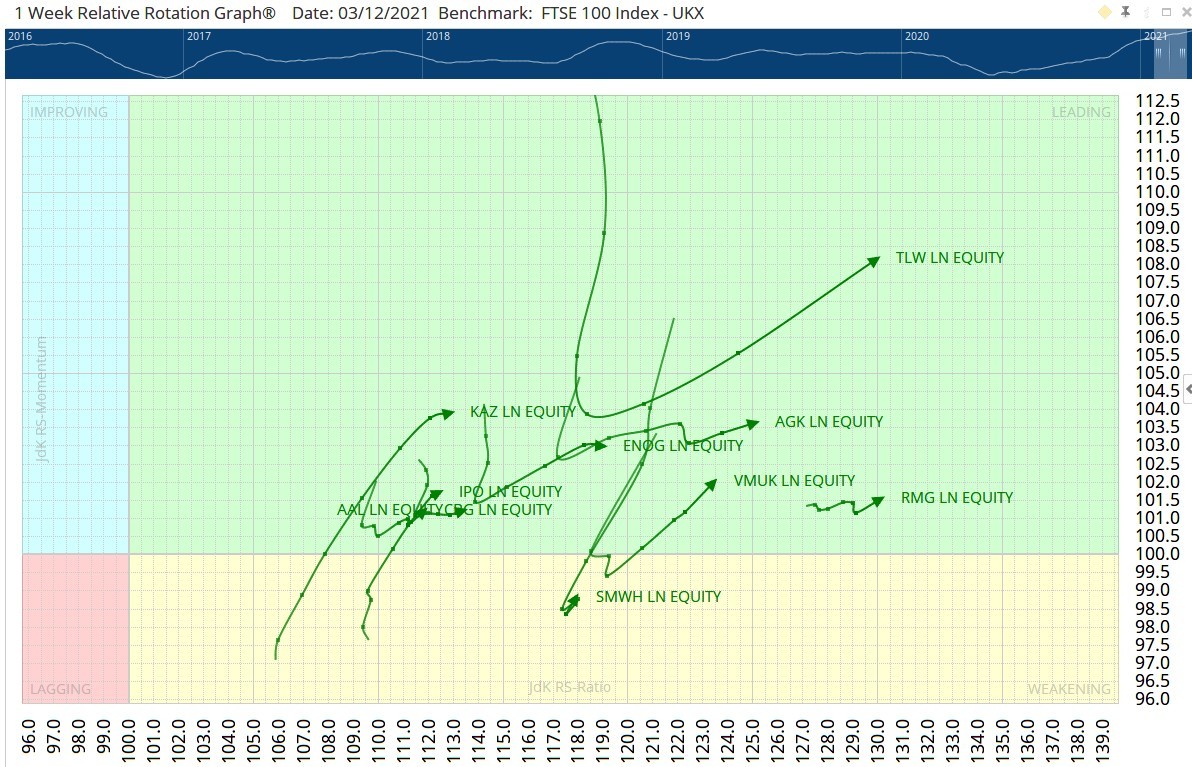
The RRG below shows the rotations of these stocks, as of their entry into the basket:
Nine out of the ten tails are inside the leading quadrant. Only SMWH is inside the ‘Weakening’ quadrant. However, that tail is already heading back up towards ‘Leading’ and that generally means that a new up-leg within the existing trend is about to start.
Constituents in focus
WH Smith

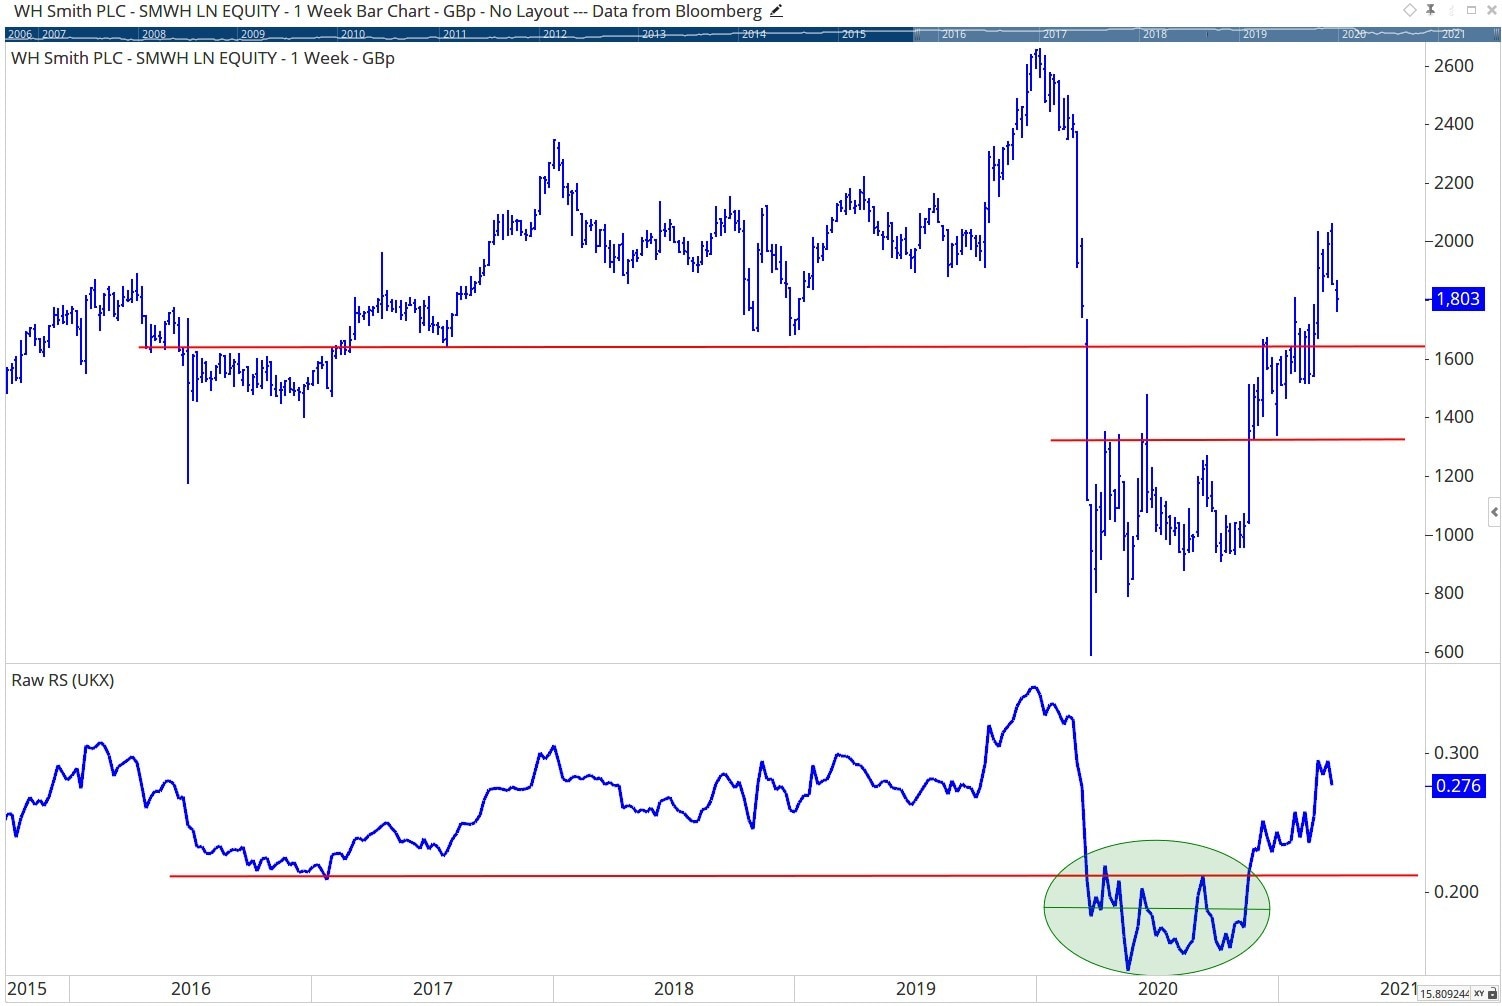
WH Smith is positioned inside the Weakening quadrant. On the chart above you can see the price in the upper pane and the relative strength of SMWH against the FTSE 100 in the lower pane. Most of 2020 is characterized by WH Smith bottoming out on a relative basis. That process completed towards the end of the year when the RS line pushed above the red horizontal line.
On the price chart, the improvement is also visible with a nice rhythm of higher highs and higher lows in place. That uptrend in price should start to drag the RRG tail back to Leading fairly soon, and drive further outperformance vs the FTSE 100.
Tullow Oil

Another new addition to the basket is Tullow Oil. Despite more than doubling in price recently, you can see on this long-term chart that it is only the beginning. There is much more upside to be captured.
The completed bottom formation on the price chart indicates that further upside is possible. The completion of the bottom in relative strength suggests that a new trend, but now upward, has begun against the FTSE 100 after a long period of underperformance.
The tail for Tullow Oil is deep inside the Leading quadrant and pushing deeper into it, fast. Given these high readings we may see the tail rolling over in coming weeks, but the current relative trend is so strong that such a setback will likely only be temporary in nature.
Other examples for stocks in the basket that are coming out of long relative downtrends and recently completed big bases in price are Aggreko and IP Group. They should be able to contribute significantly to the performance of the basket for Q2.
Continue reading for FREE
- Includes free newsletter updates, unsubscribe anytime. Privacy policy


