Advanced technical analysis: 5 key analysis techniques
Technical analysis is a form of analysis used by traders to evaluate future price action based on historical price data.
Many traders use technical indicators and charting analysis as an approach to analyse the markets and spot potential trading opportunities and suitable entry and exit points. This article looks at five advanced approaches to technical analysis to help you improve your trading strategy.
Lots of traders use candlestick charts when looking at price data and it is easy to see why. Candlesticks present the battle between buyers and sellers in a very simple-to-interpret graphical way. Candlestick charts also have their own range of patterns, with many focusing on the psychology of the market and constant battle between buyers and sellers.
Bullish engulfing pattern
The bullish engulfing pattern occurs when a market has been in a downtrend. Bullish engulfing patterns usually consist of two complete candlesticks spanning two time periods (for instance one hour or one day). The first is a 'down' or bearish candlestick, followed by an 'up' or bullish candlestick covering the subsequent time period.
The size of the first candle can vary from chart to chart. The first candle usually signifies the end of declining prices for the markets. The second candle in the pattern should be bigger than the previous candle and should cover (or engulf) the 'body' of the previous candle. The bigger the second candle and the higher it advances, the stronger the signal.
Here is an example of the FTSE 100 index based on daily candlesticks.
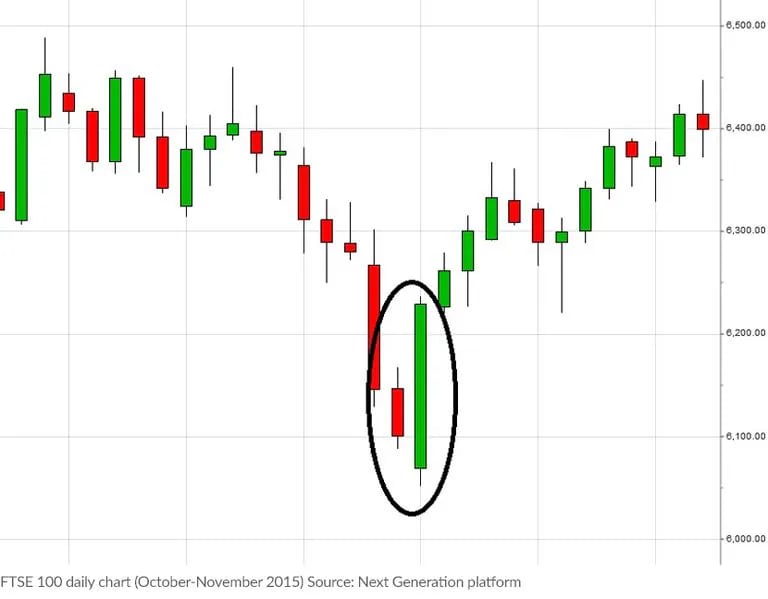
In this example, the market had been falling for more than a week but there is a relatively large 'up' day that completely overshadows the previous day’s candle. These two candles together form the bullish engulfing pattern and suggest that weakness is coming to an end and the trend may be about to reverse.
Bearish engulfing pattern
Bearish engulfing patterns are a mirror image of the bullish variety, with the difference being that with bearish engulfing patterns the market is heading higher, but then there is a candle in the opposite direction to the trend which engulfs the previous candle – signifying a change in sentiment from buying pressure to selling pressure.
As with the previous candlestick chart pattern, the first candle in this formation signifies that the current trend is coming to an end. The size of the first candle can vary from chart to chart and it is the second or 'engulfing' candle that signals the change in trend. To qualify as a bearish engulfing pattern, the second candle must completely engulf the previous candle. Ideally, the high should extend above the previous candle's high and a new low should be created – signifying renewed downward selling pressure.
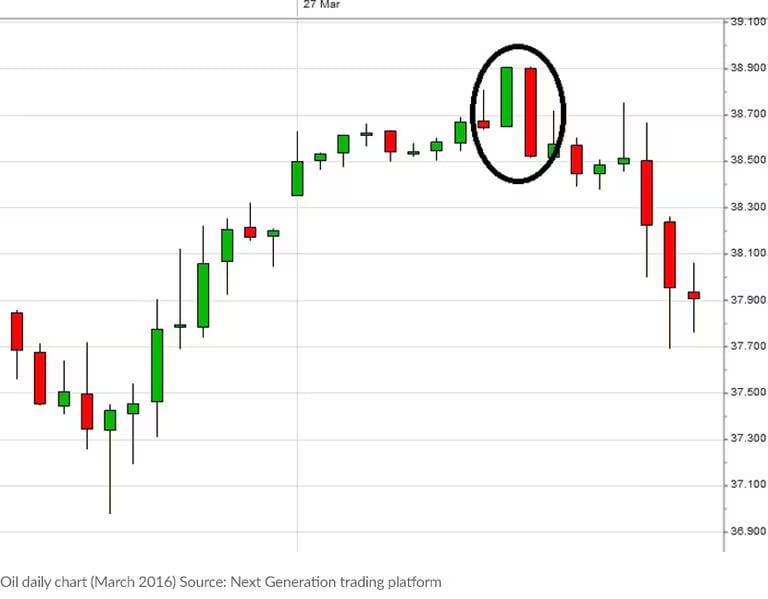
The below example shows the price of oil, and each candle represents one hour of trading.
As with all other trading strategies, candlestick charts should be used in conjunction with other forms of analysis to weigh up when market sentiment may be shifting.
Bullish divergence signal
Many traders will use technical indicators to figure out market direction. You may have seen charts with stochastic oscillators, moving average convergence divergence (MACD) and other lines underneath the price. One variation of the indicator approach is to look for divergences. This is where the price does one thing but the indicator does something else – it can be a sign that a trend is running out of steam, offering the opportunity to profit from a move in the other direction. In the chart below, the price of gold has a relative strength index (RSI) shown below the price, which is always a popular indicator.
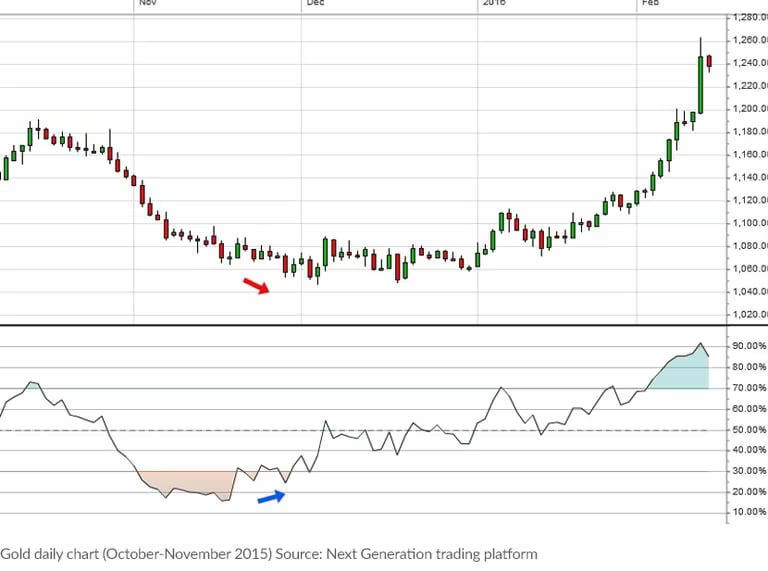
In the chart above, it can be seen that there is a significant slide in the price of gold, as indicated by the red and blue arrows, and the RSI becomes very oversold, pointing to how weak the market has been. Later in the same month and the following month, the price of gold slips further, below those previous lows. But interestingly, the RSI has started moving higher. This is bullish divergence – and can be a suggestion that the downtrend is running out of steam, which proved to be the case in this example.
Bearish divergence signal
For every positive pattern there is usually a negative alternative and this is also the case when it comes to divergence. When a market is making higher highs, but the RSI is not following suit, this is referred to as 'bearish divergence' and can be a warning that a top is near. The example below is an hourly chart for the GBP/USD forex pair. As indicated by the blue and red arrows below, the market was strong towards the middle of the month but the RSI then makes a lower high than previously, suggesting that momentum may be starting to fade away.
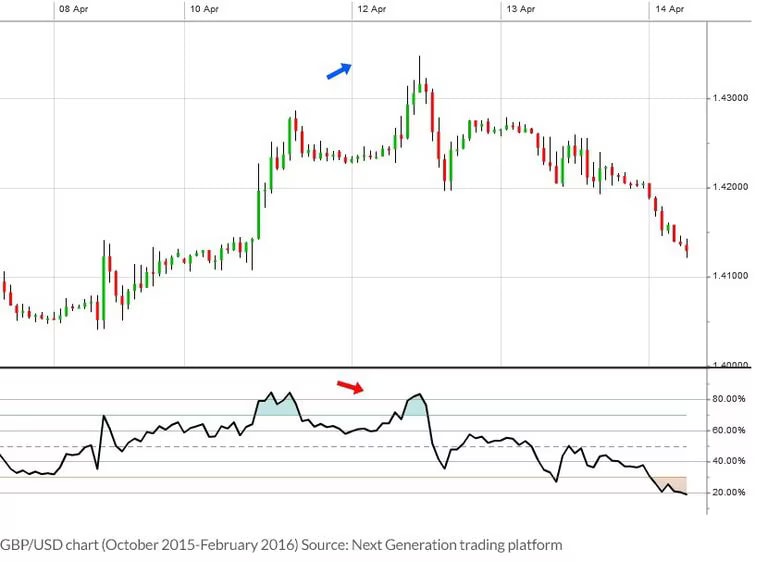
This divergence approach using indicators is thought to be more reliable than just using them as simple overbought or oversold signals. As ever, nothing works all the time but they can help to 'take the temperature' of a market and act as a warning that a previously good trend could be about to stall.
The false breakout
As mentioned before, no trading strategy is right all of the time but even false signals can give a hint into market direction. The breakout strategy is a popular one with momentum traders: when a previous low or high is broken on the chart some will see it as the sign of a new trend. But a lot of the time this does not happen. This false breakout can still give us an aggressive trading strategy and is a useful bit of technical analysis on its own.
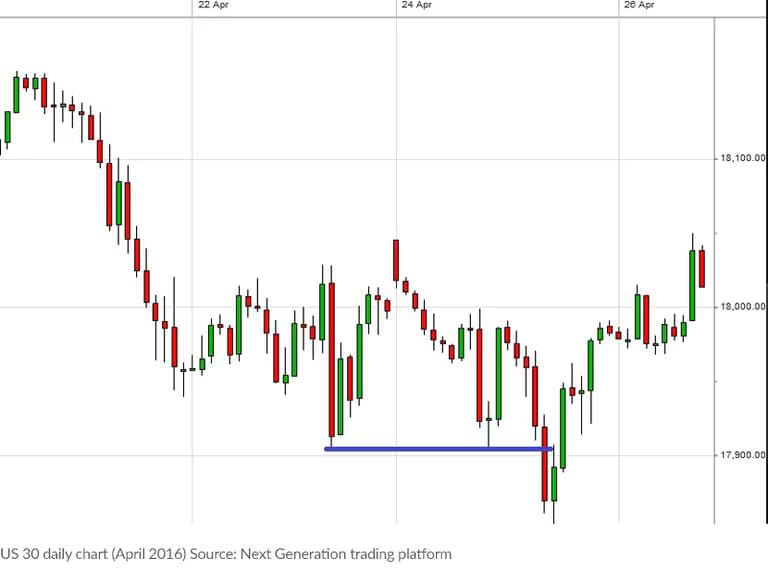
The US 30 index chart demonstrates this. The 17,900 level had acted as support over a couple of days. The market then broke below this, but very quickly tried to regain its lost ground. There was no real follow-through of selling. An aggressive trading strategy would be to buy into this strength with a stop-loss order below the low following the break of that support. False signals like this can end up being powerful. In this example weak sellers were flushed out and the market ended up moving 150 points higher.
Summary
As a trader, it’s important to remember that no one form of analysis can be 100% accurate all of the time. It’s therefore invaluable to use a combination of trading strategies and technical indicators to identify potential entry and exit points, so you can put together a robust trading strategy.
Disclaimer: CMC Markets is an execution-only service provider. The material (whether or not it states any opinions) is for general information purposes only, and does not take into account your personal circumstances or objectives. Nothing in this material is (or should be considered to be) financial, investment or other advice on which reliance should be placed. No opinion given in the material constitutes a recommendation by CMC Markets or the author that any particular investment, security, transaction or investment strategy is suitable for any specific person. The material has not been prepared in accordance with legal requirements designed to promote the independence of investment research. Although we are not specifically prevented from dealing before providing this material, we do not seek to take advantage of the material prior to its dissemination.

