Spread bets and CFDs are complex instruments and come with a high risk of losing money rapidly due to leverage. 68% of retail investor accounts lose money when spread betting and/or trading CFDs with this provider. You should consider whether you understand how spread bets, CFDs, OTC options or any of our other products work and whether you can afford to take the high risk of losing your money.

Technical indicators

Trading indicators are popular tools in technical analysis that can help traders to predict future price movements within the financial markets. Explore our wide range of technical trading indicators below.

WINNER2021

No.1 Platform Technology

ForexBrokers.com

WINNER2019

Best Performance Tools

Professional Trader Awards

WINNER2020

Best Trading Execution

Professional Trader Awards

What are trading indicators?

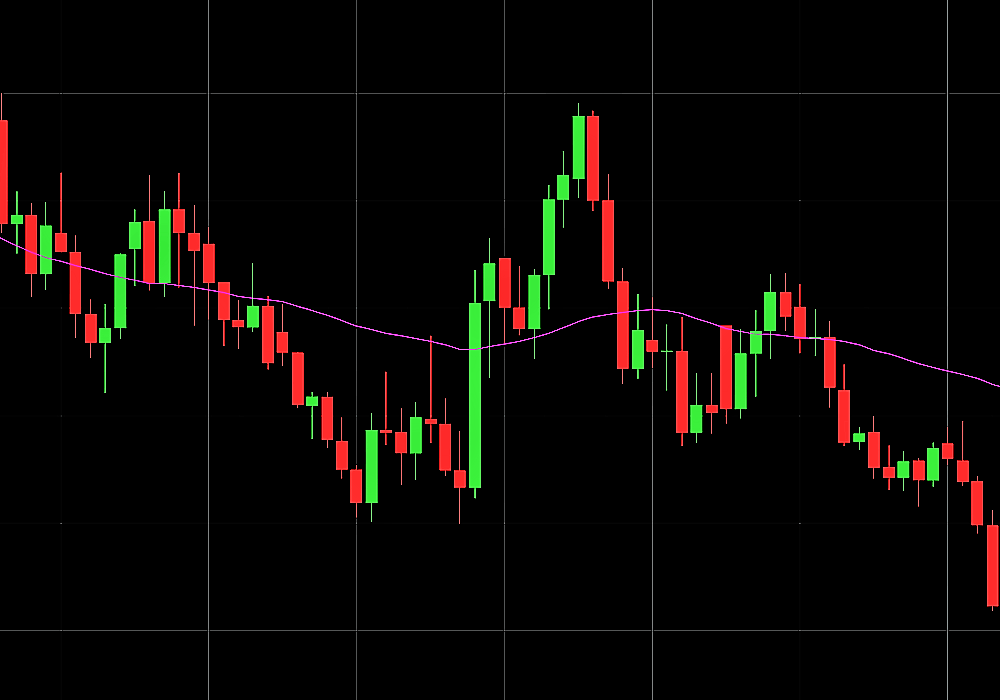
Trading indicators use mathematical calculations based on historical price action and volume to forecast future price movements, providing trade entry and exit signals. Technical indicators are displayed over or below price charts to help traders identify trends and overbought or oversold situations. Having an understanding of technical indicators is useful when building a trading strategy.

Our award-winning web trading platform​​, Next Generation, comes with a wide range of technical indicators for both short and long-term trades. Browse some common technical trading indicators, both leading and lagging​, that can help to identify momentum and bullish and bearish trends within the financial markets.


List of trading indicators

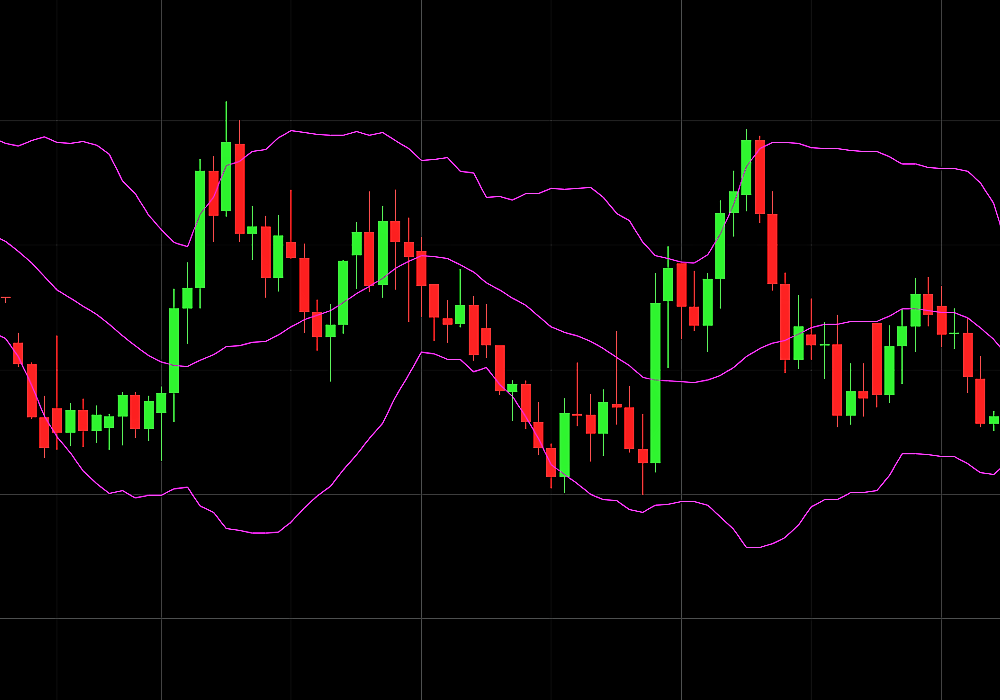
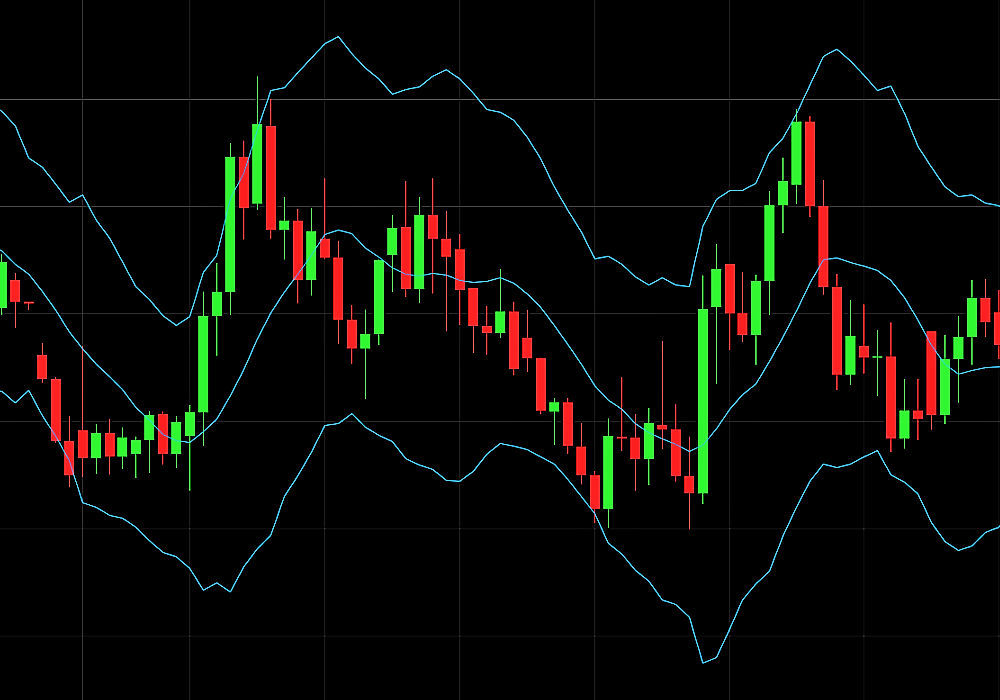
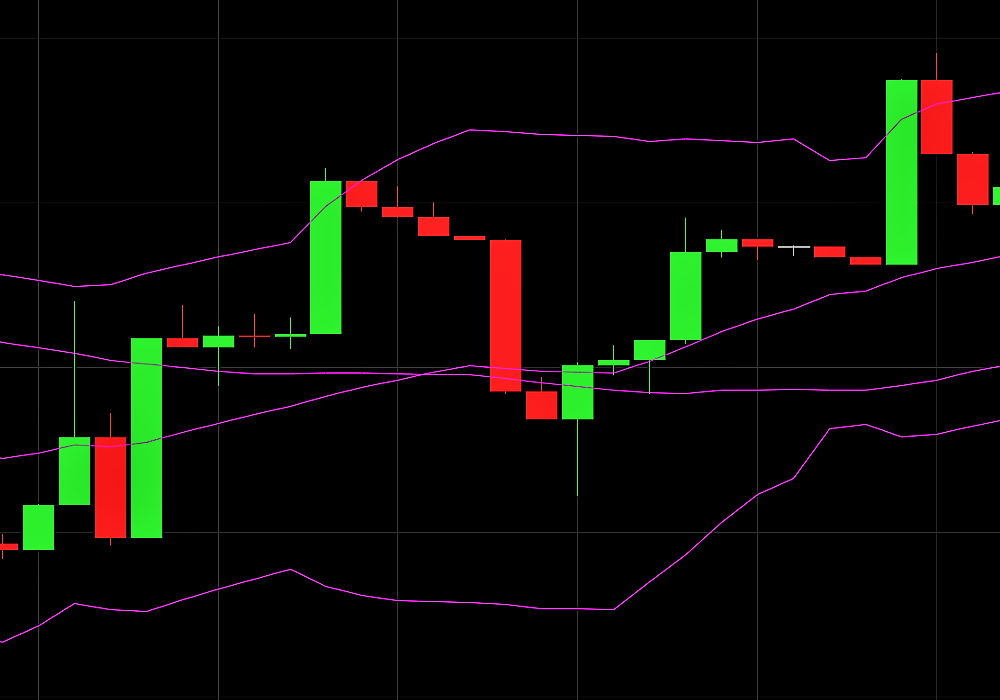
Bollinger Bands

What are Bollinger Bands? A popular technical analysis tool, Bollinger Bands indicate whether an instrument's price is high or low on a relative basis.

Relative strength index (RSI)

The relative strength index (RSI) is a popular momentum oscillator. Learn about how in trading, the RSI indicator is used to determine the future direction of a market.

Simple moving average (SMA)

The simple moving average (SMA) is a popular tool for all financial markets. Learn to calculate the SMA formula to use as part of your SMA trading strategy.

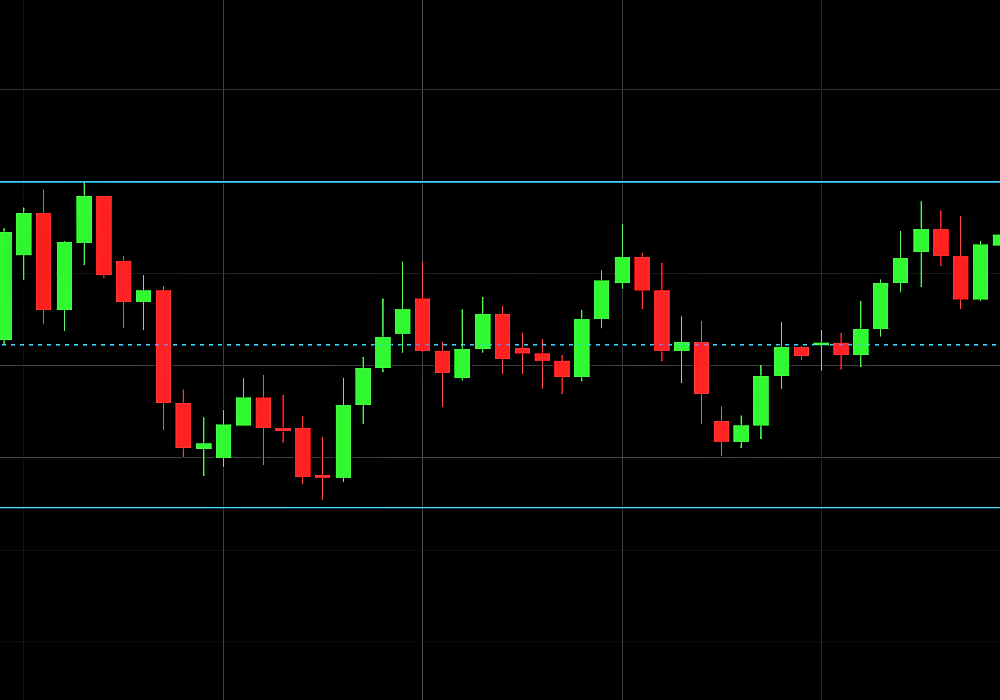
Support & resistance

Support and resistance levels establish where market drivers such as supply and demand meet on a trading chart. Learn how to establish S&R, a very important skill.

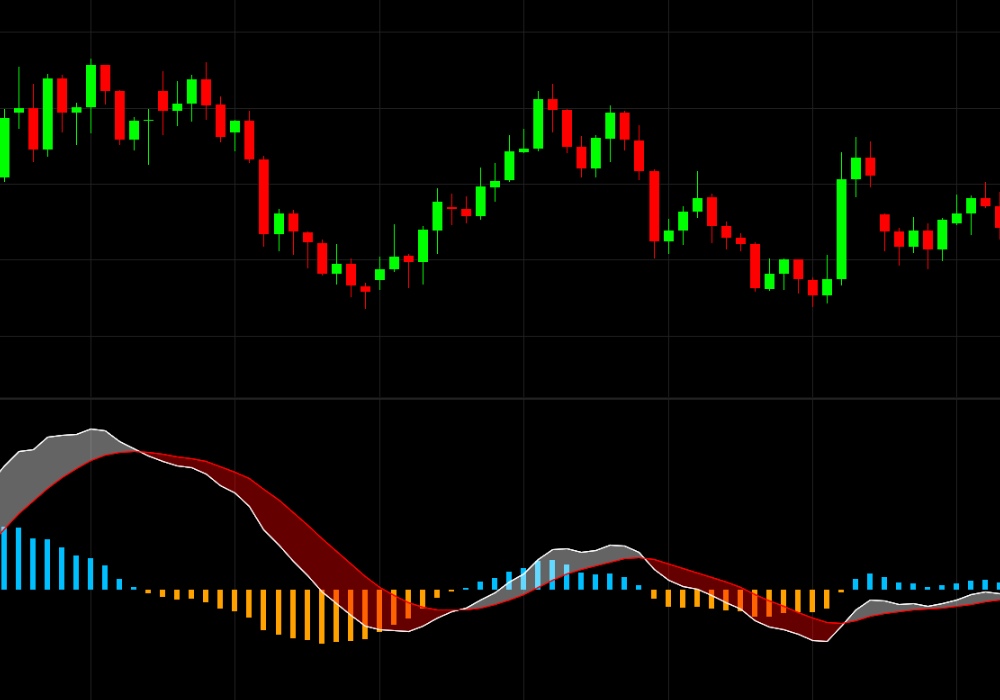
Moving average convergence divergence (MACD)

The MACD indicator is used to determine the strength and momentum of a trend and is calculated using price data. Learn how to trade with the MACD indicator here.

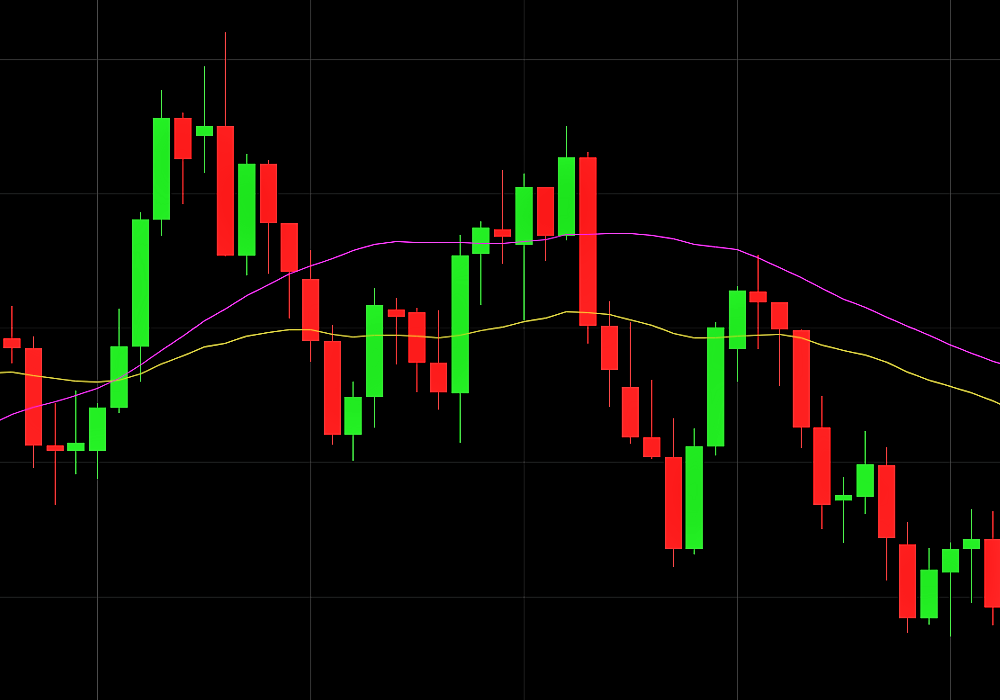
Exponential moving average (EMA)

The exponential moving average is a technical indicator used to measure trends of financial securities, related to the SMA. Learn more about EMA trading.

Average true range (ATR)

Discover how to use the ATR indicator to measure volatility within the financial markets. Improve your average true range strategy in derivative trading.

Heikin-Ashi

The Heikin Ashi is both a technical analysis indicator and chart type. Discover how to use the Heikin Ashi when trading various markets and strategies.

Explore our range of technical tools

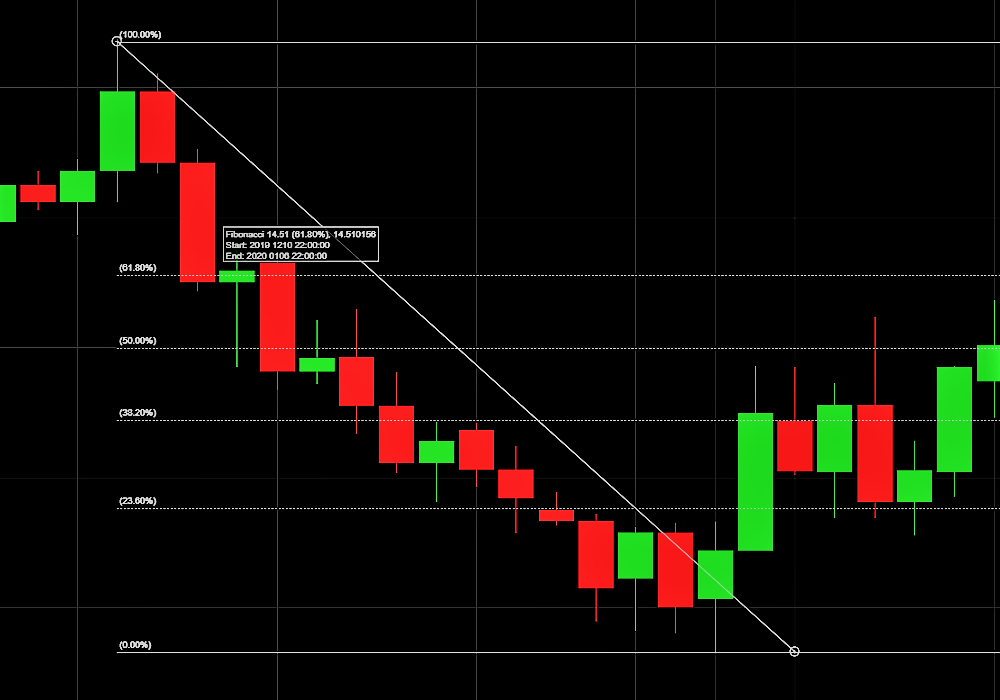
Fibonacci retracements

Fibonacci retracements form a popular technical analysis tool that is used by traders to identify future price movements when investing in their trade.

Keltner channels

Learn how to trade with Keltner channels, a technical indicator for the financial markets. Perfect your Keltner channel strategy and calculations.
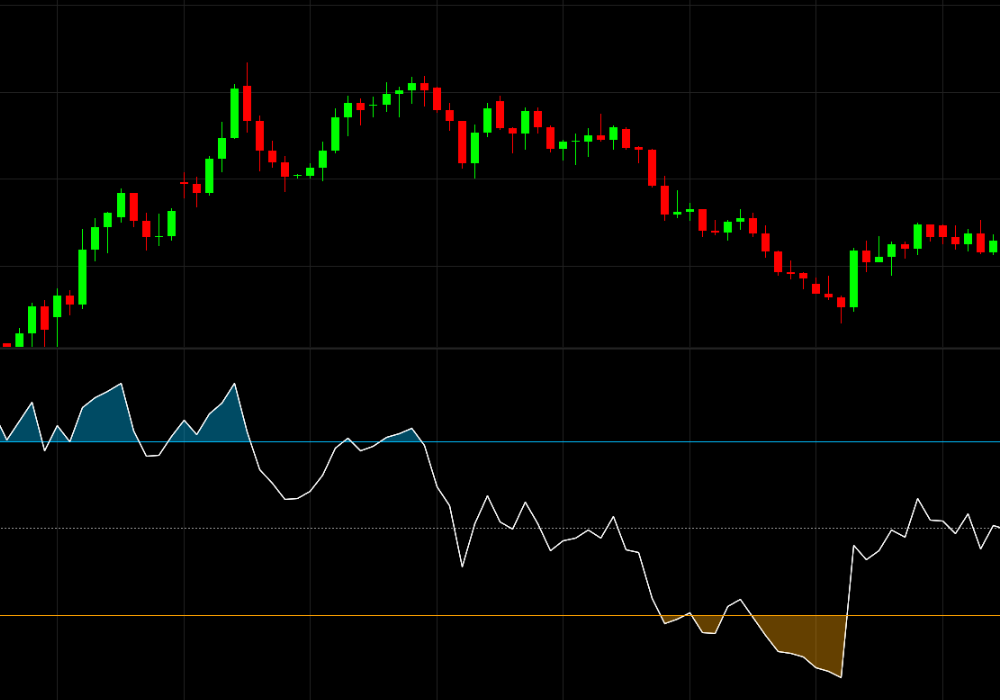
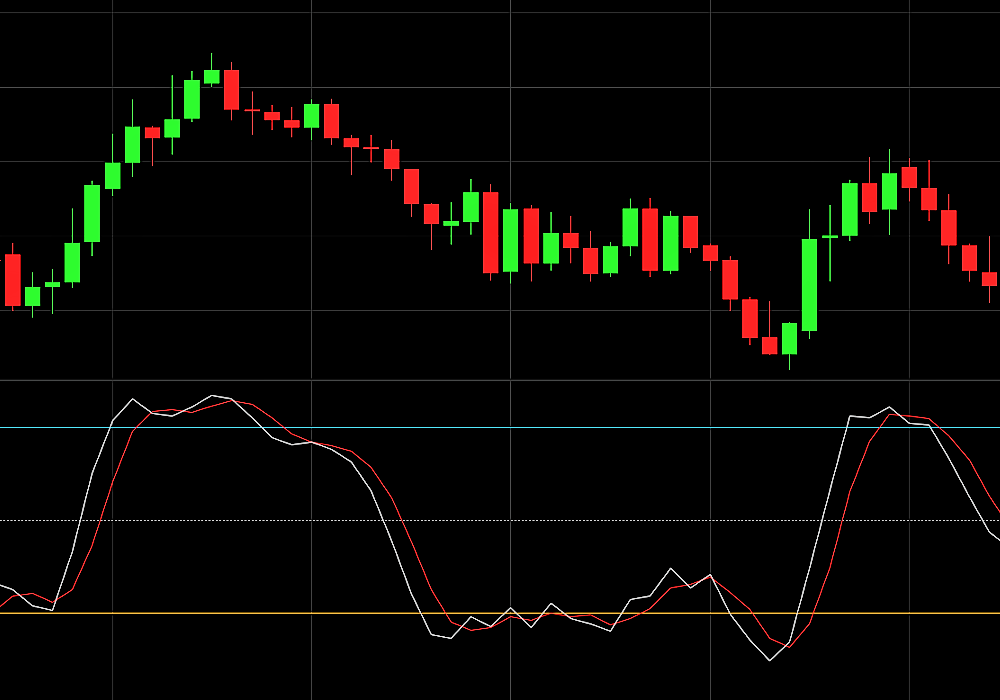
Stochastic indicator

The stochastic indicator or stochastic oscillator is a technical analysis tool that predicts trend reversal and identify overbought and oversold levels. Find out more here.

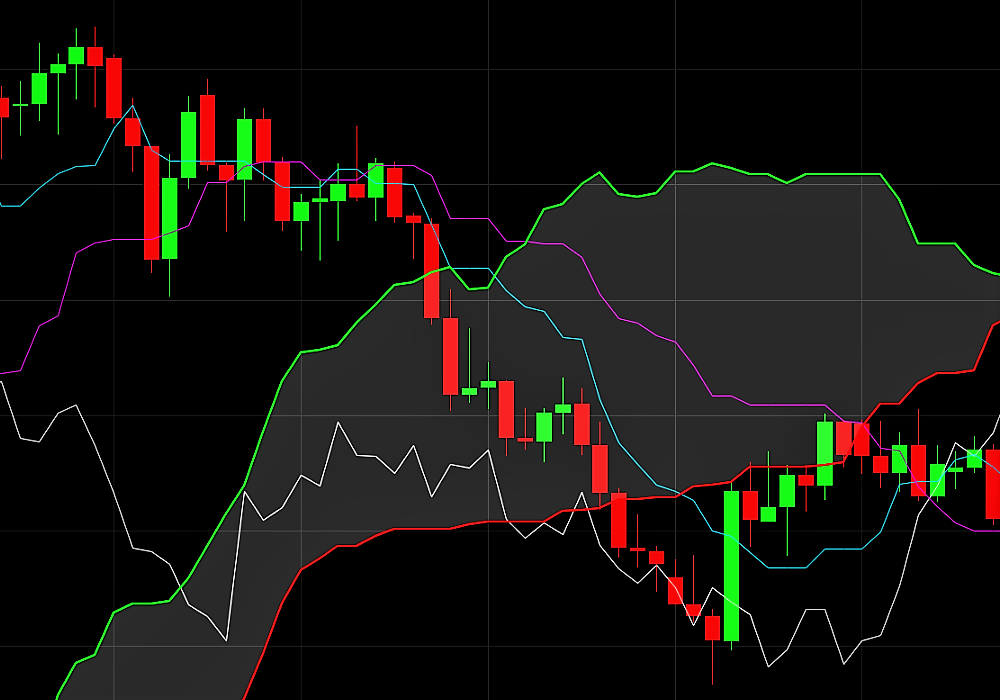
Ichimoku Cloud

Ichimoku Cloud is a technical indicator and trading system that defines support and resistance and identifies trend direction. Discover how to use it in trading.

Pivot points

Learn how to use pivot points when trading the financial markets. Pivot points help traders to identify trends and entry and exit points.
Standard deviation

Traders use standard deviation to estimate the implication of a price movement. Find out what is standard deviation and how to use it in trading.

Average Directional Index (ADX)

Learn how to use the average directional movement index in trading and how it is calculated. Improve your ADX indicator trading strategy here.

Donchian channels

Learn about the Donchian indicator in technical analysis and how to use Donchian channels as part of an effective trading strategy.

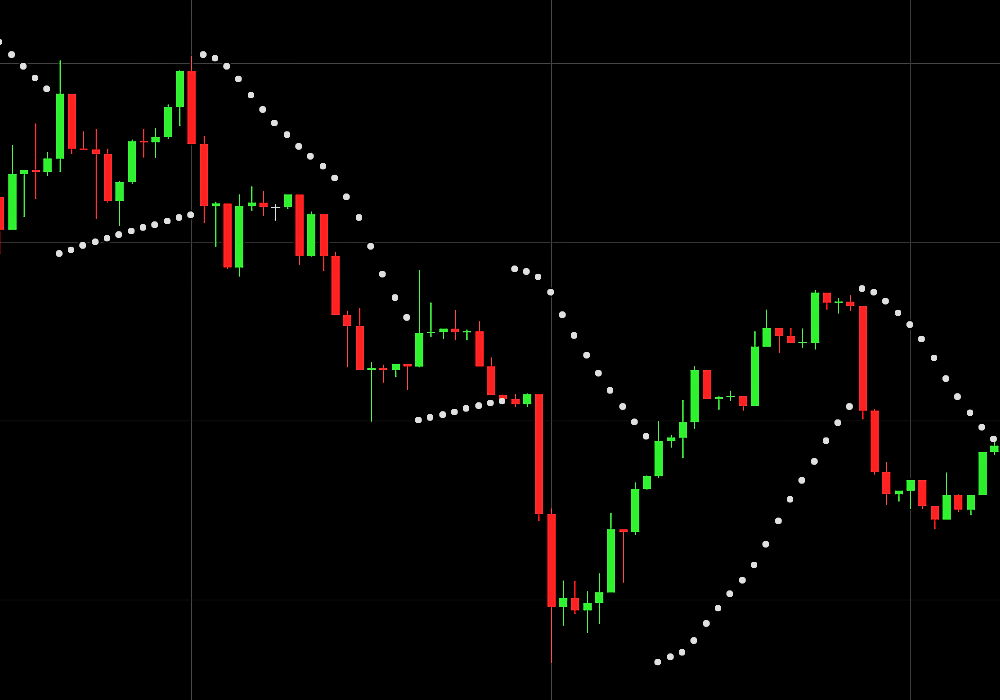
Parabolic SAR

Parabolic SAR can be used as both a technical trend indicator and a trailing stop-loss order. Find out what is parabolic SAR and how to use it in trading.

Awesome oscillator (AO)

The awesome oscillator is a technical indicator that predicts market momentum. Find out how to read the awesome oscillator and how to use it in trading.

Elliott Wave theory

Elliott Wave theory breaks down the price fluctuations of financial markets into cycles, each comprising of eight ‘waves’. Find out more about Elliott Wave.

FAQS

What are the different types of trading indicators?

There are many types of indicators that focus on trend, momentum, volatility, and volume. These are also split between lagging indicators (what has already happened) and leading indicators (what could happen next). Read more about leading and lagging indicators in trading.

How are technical indicators used?

Traders can apply technical indicators to charts to provide information of where a price has been, or where it will likely go. These predictions can help traders to decide on entry and exit points for a potential trade and build an effective trading strategy.

What are the best indicators for short-term trading?

When it comes to short-term trading, including scalping, day trading and swing trading, it can be useful to apply an indicator that tracks short-term price movements. This can include moving averages, relative strength index (RSI), stochastic indicators, and Bollinger Bands. Learn about short-term trading strategies.

*The Financial Services Compensation Scheme is an independent body that offers protection to customers of financial services firms that have failed. The compensation amount may be up to £85,000 per eligible person, per firm. Eligibility conditions apply. Please contact the FSCS for more information.