Spread bets and CFDs are complex instruments and come with a high risk of losing money rapidly due to leverage. 69% of retail investor accounts lose money when spread betting and/or trading CFDs with this provider. You should consider whether you understand how spread bets and CFDs work and whether you can afford to take the high risk of losing your money.

Donchian channels

Donchian channels are moving averages that help to identify potential trends through breakouts and retracements. The three channel lines that form moving average calculations are part of a technical indicator​ that is used within the financial markets to predict uptrends and downtrends of an asset’s price.

The Donchian indicator was developed by Richard Donchian in the 1950s, a successful trader within the futures market, in order to help him identify trends within price charts. Donchian channels are most commonly used with candlestick charts​, as these give a clear and simple display for traders to interpret. The indicator monitors price movements of a security, such as a currency pair, share or commodity, which can then trigger trading signals. Donchian channels are a type of technical analysis​ within trading, where traders ignore all fundamental factors that may have an impact on an asset’s price, and instead focus on price action and historical data only. Read on to discover how to trade using Donchian channels.

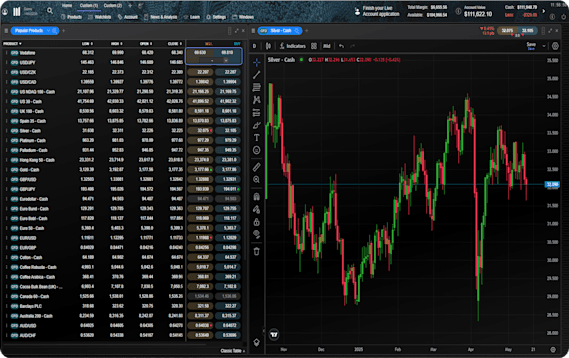
See inside our platform

Get tight spreads, no hidden fees and access to 12,000 instruments.

What is the Donchian indicator?

Donchian channels are made up of three lines: a moving average​​ in the centre, an upper band and a lower band. The upper band measures the highest rise of an asset’s price, the lower band measures the lowest that the price drops to, and the moving average line represents the median or average price that an asset fluctuates between. This is based on a timeframe that can range from just a few minutes to a few months. Therefore, traders can rely on Donchian channels for both short-term and long-term measurement of trends.

The Donchian indicator aims to find relationships between the current and past price of an asset, to show whether there are bullish or bearish​​ trends within a specific time period. The upper band represents the highest price an asset achieved, which is an indication of bullish energy, whereas the lower band represents the lowest price an asset achieved within tougher bearish reversals.

Donchian channels vs Bollinger Bands

Bollinger Bands are a similar technical indicator to Donchian channels, as they also help to capture price action in volatile markets over a set period of time. However, the structure of Bollinger Bands​ is slightly different. The indicator similarly consists of three lines on a trading chart and the middle line is the simple moving average (SMA) of the asset’s price. Whereas Donchian upper and lower channels measure the highest highs and lowest lows, Bollinger Bands use the standard deviation​ to calculate the bands. The upper band is the SMA plus two standard deviations and the lower band is the SMA minus two standard deviations.

Donchian channel formula

It is possible to calculate all three lines of the Donchian channels by using these simple formulas below. In this instance, ‘N’ represents the timeframe that the Donchian channel is calculated for, whether this be the number of minutes, hours, days or months. Traders often use 20 days as a benchmark for channel calculations.

Upper channel = highest high in previous N periods

Lower channel = lowest low in previous N periods

Middle line = ((upper channel – lower channel) ÷ 2)

Our online trading platform​​ calculates these formulas automatically when you open a position and apply the Donchian indicator to your chart. Therefore, it is not necessary to memorise these calculations, but it is a good idea to have a general understanding of how they work.

How to use a Donchian channel strategy

Donchian channels produce trading signals after measuring the momentum of a trending market. The indicator helps traders to realise when there is a breakout within the market so that they can ride the trend for as long as possible, until the trend starts to fade. If an asset’s price is trading smoothly around the SMA line and does not cross into either channel, this may indicate that the market is less volatile and there is no clear bearish or bullish trend. However, if the instrument deviates from the moving average line, this can go in two directions:

Join a trading community committed to your success
  • If the price moves toward the upper channel, this can prompt traders to open a long position and profit from the asset increasing in value.
  • If the price moves toward the lower channel, this can prompt traders to open a short position and profit from the asset decreasing in value.

Donchian breakout strategy

As we have discussed above, the divergence of price between channels helps traders to choose whether to open a long or short position. They can also use a breakout strategy to determine whether to close their positions. For example, after opening a long position to trade on an uptrend​, the price of a security may continue rising until it hits the upper band. If it manages to break through even further, many traders may choose to keep their long positions open in order to ride the bullish trend.

However, if it hits the upper band but does not manage to break through, this is known as a breakout. If traders are uncertain that the bullish trend will continue and instead predict a bearish reversal coming, they may decide to close their positions and short sell as the assets starts to decline in price. Sell signals are particularly common within the share market, as stock prices are known to be very volatile and can rise and drop at extremes. Learn more about how to short a stock​ here, which is one of the most popular trading strategies​ for this market.

Donchian channel in forex

As well as the stock market, Donchian channels are often used within forex trading​, along with other popular trend indicators, such as Bollinger Bands and Keltner channels. This is because the value of currency pairs fluctuate often, introducing short-term price trends, as well as long-term trends of established ‘safe haven’ currencies. A popular trading strategy to use with Donchian channels is day trading​, where it is possible to take advantage of currency price movements, also known as pips, in order to make small but frequent profits. The Donchian indicator helps to identify when a currency pair closes above or below the bands, signalling the trader to liquidate their current position and switch to a long or short, depending on where it has closed.

How to trade with Donchian channels

  1. Open a demo account to practise your Donchian channel strategy. Choose which market and asset you would like to trade and apply the indicator, using our customisable platform.
  2. Study price action for trading opportunities. Look for when the asset’s price diverges away from the simple moving average line. You could also look for a breakout above or below the upper and lower bands to identify a bullish or bearish trend.
  3. Enter the trade with a long or short position, depending on the price direction.
  4. In case of false breakouts or trend reversals, some traders may choose to use a stop-loss order. This can help to prevent loss of capital in a volatile market.
  5. When you are ready to trade with real money, register for a live account to deposit funds.

Donchian trading system

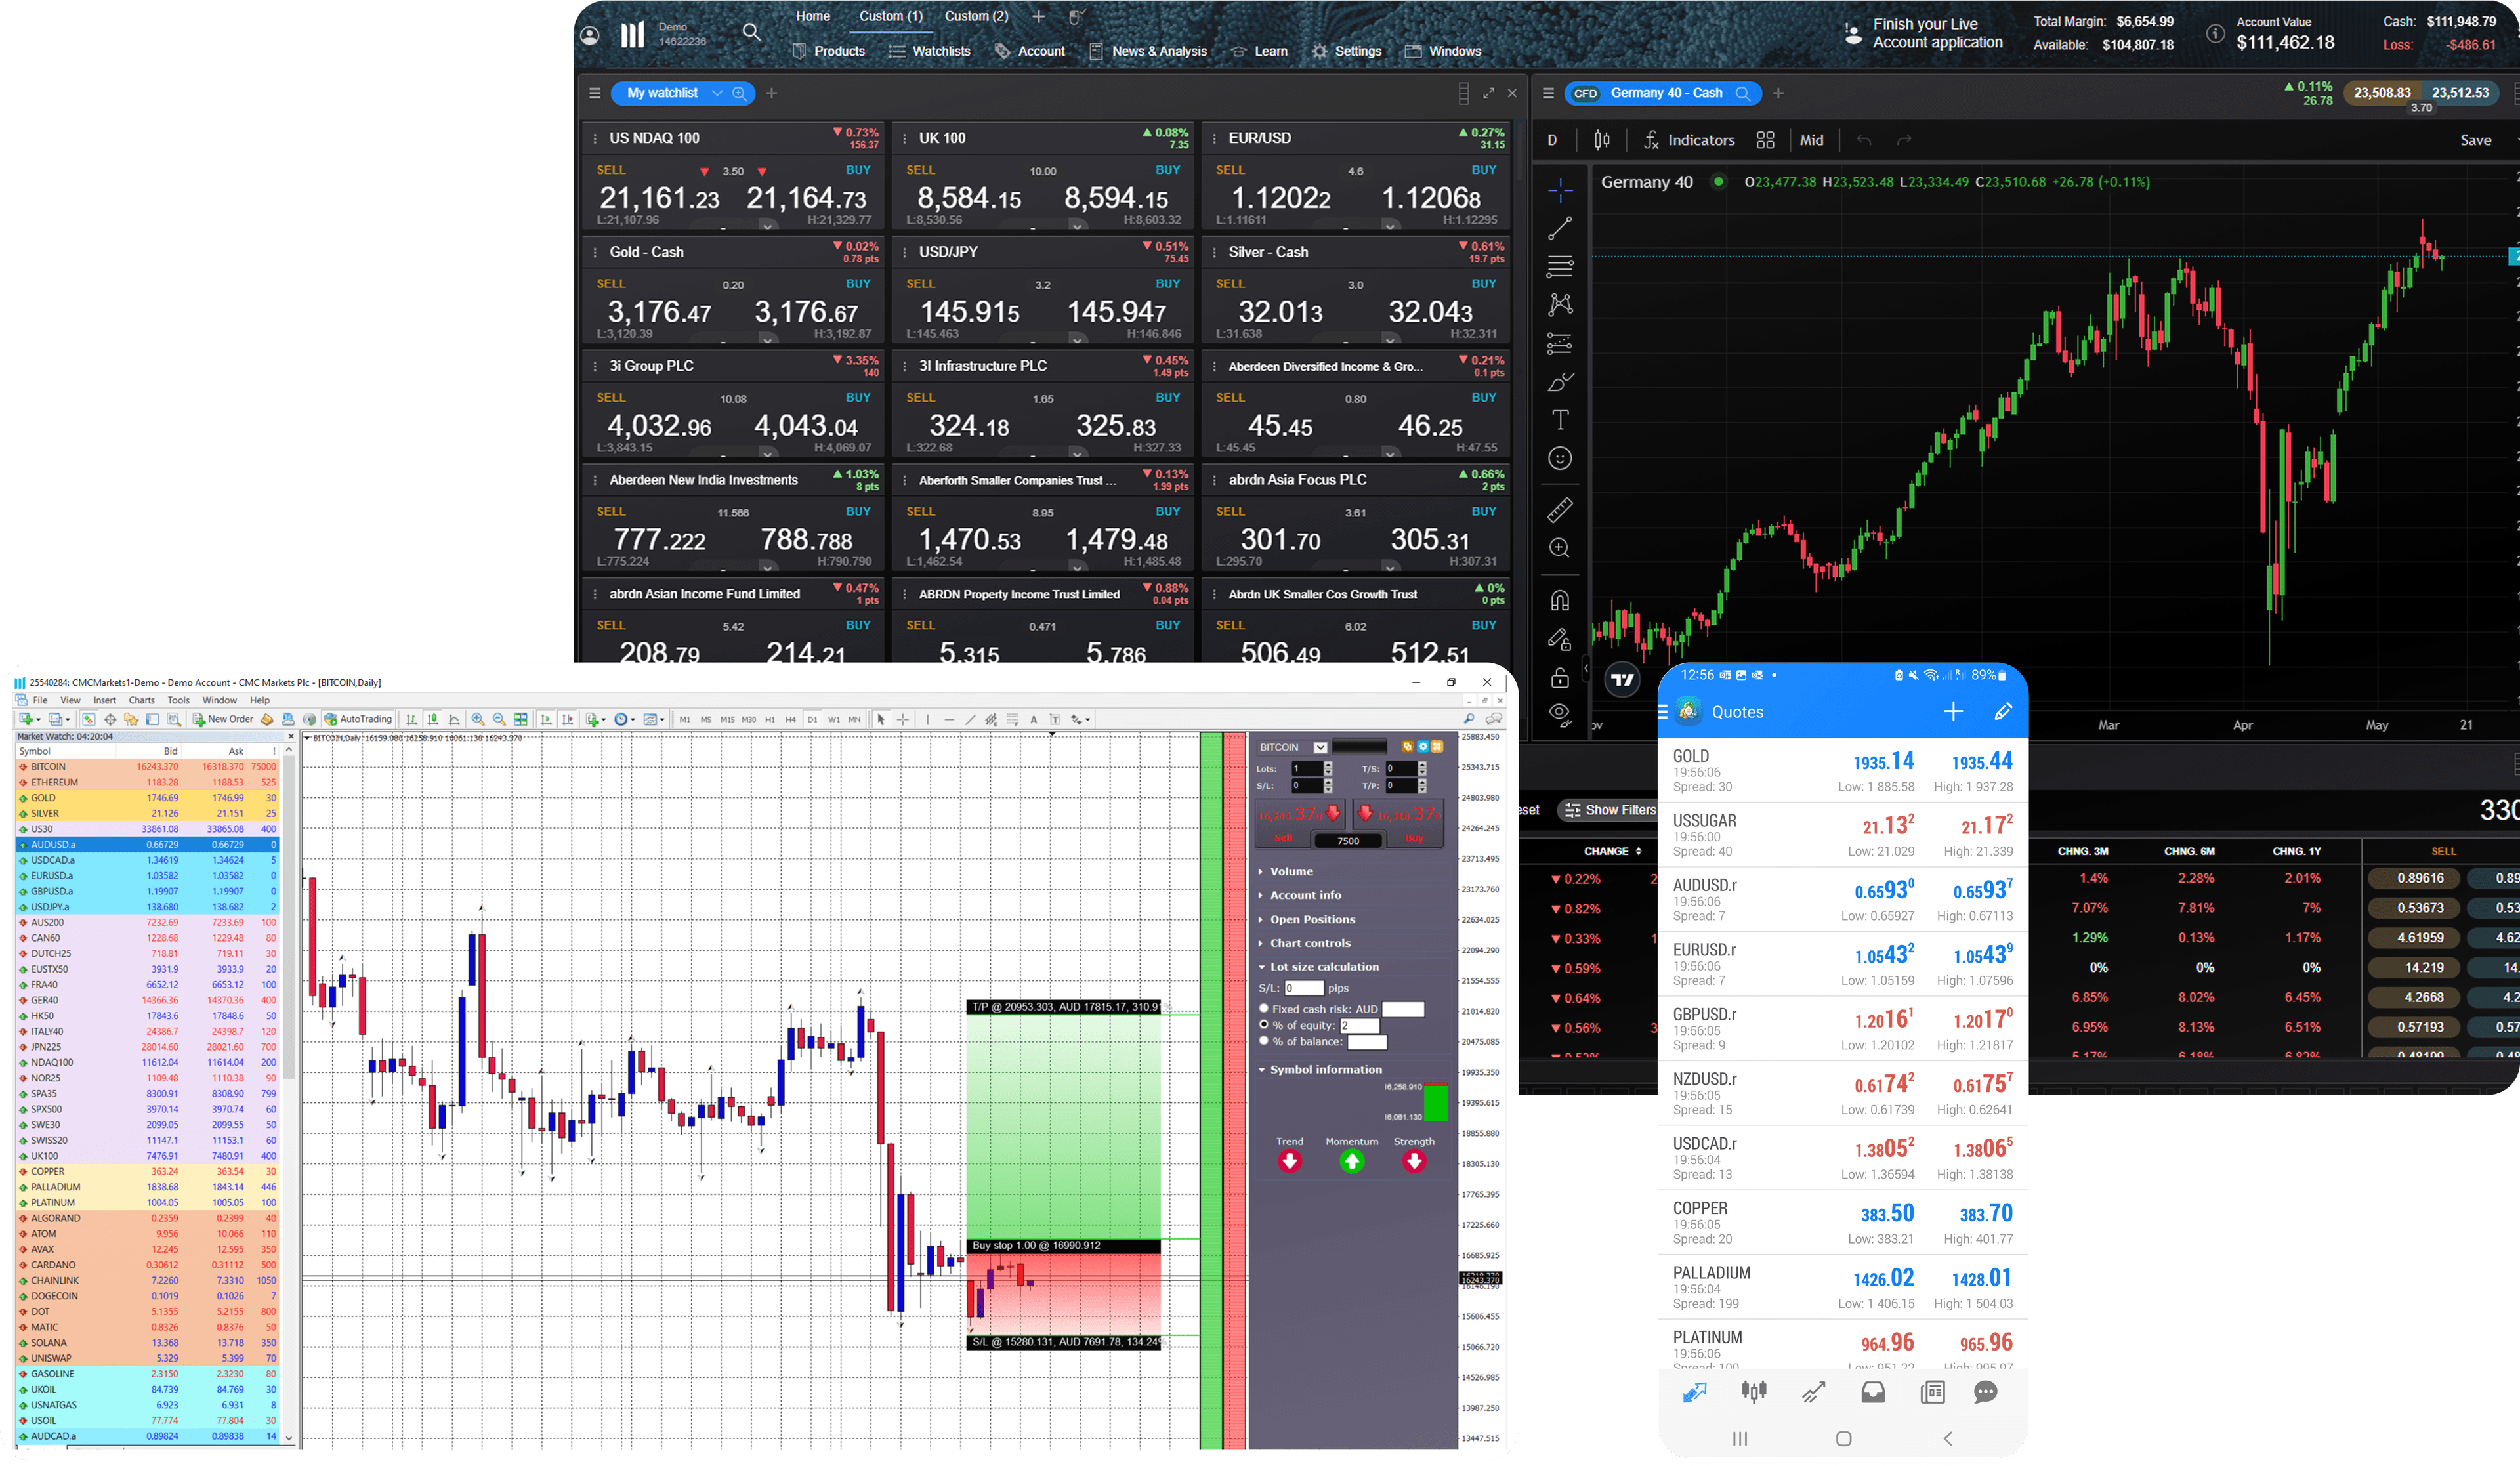
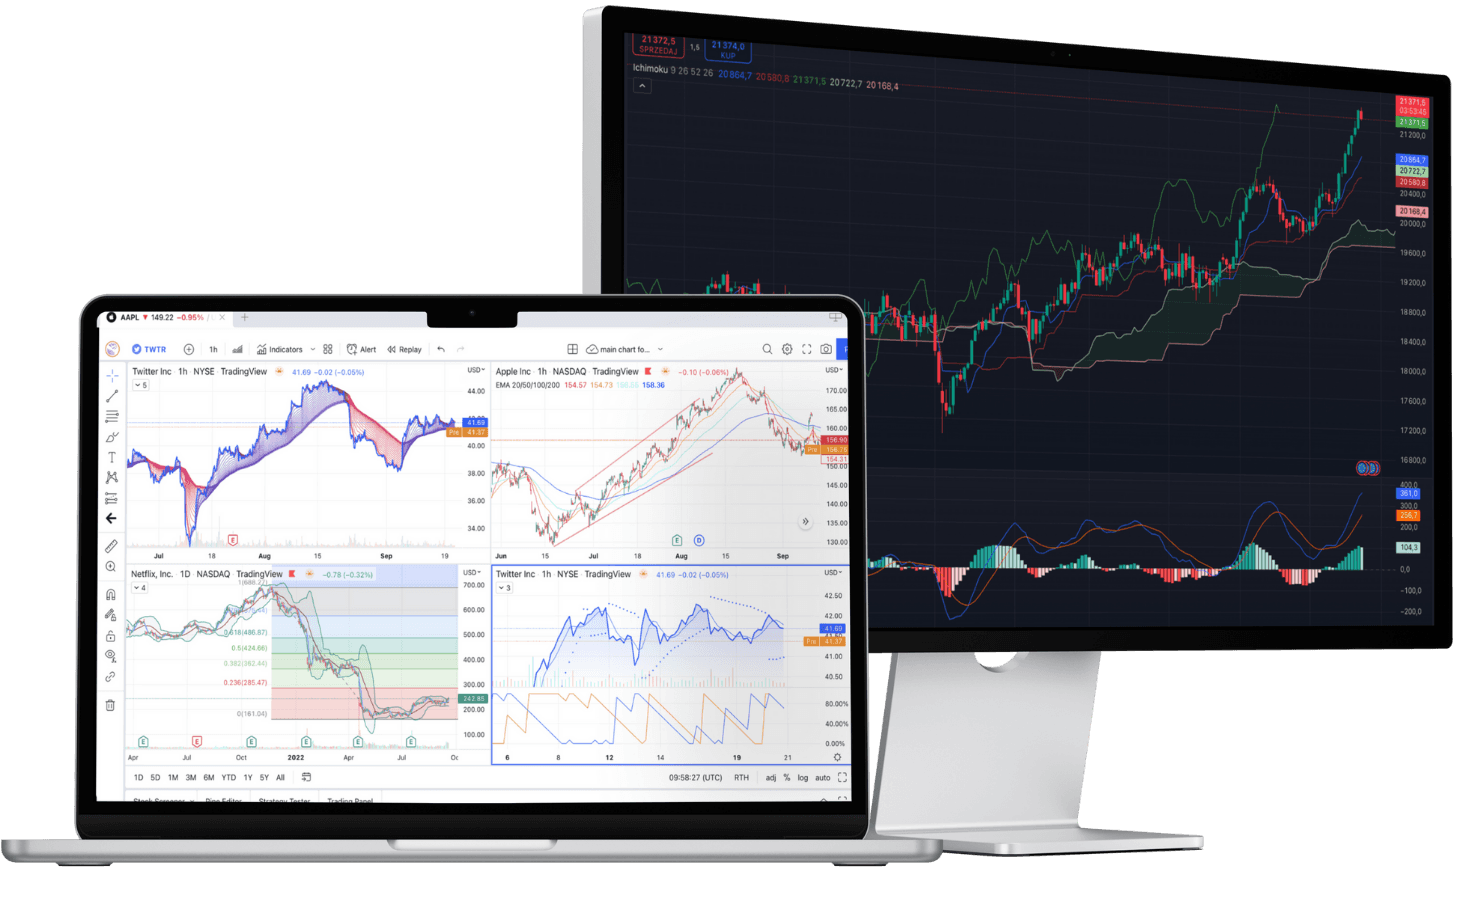
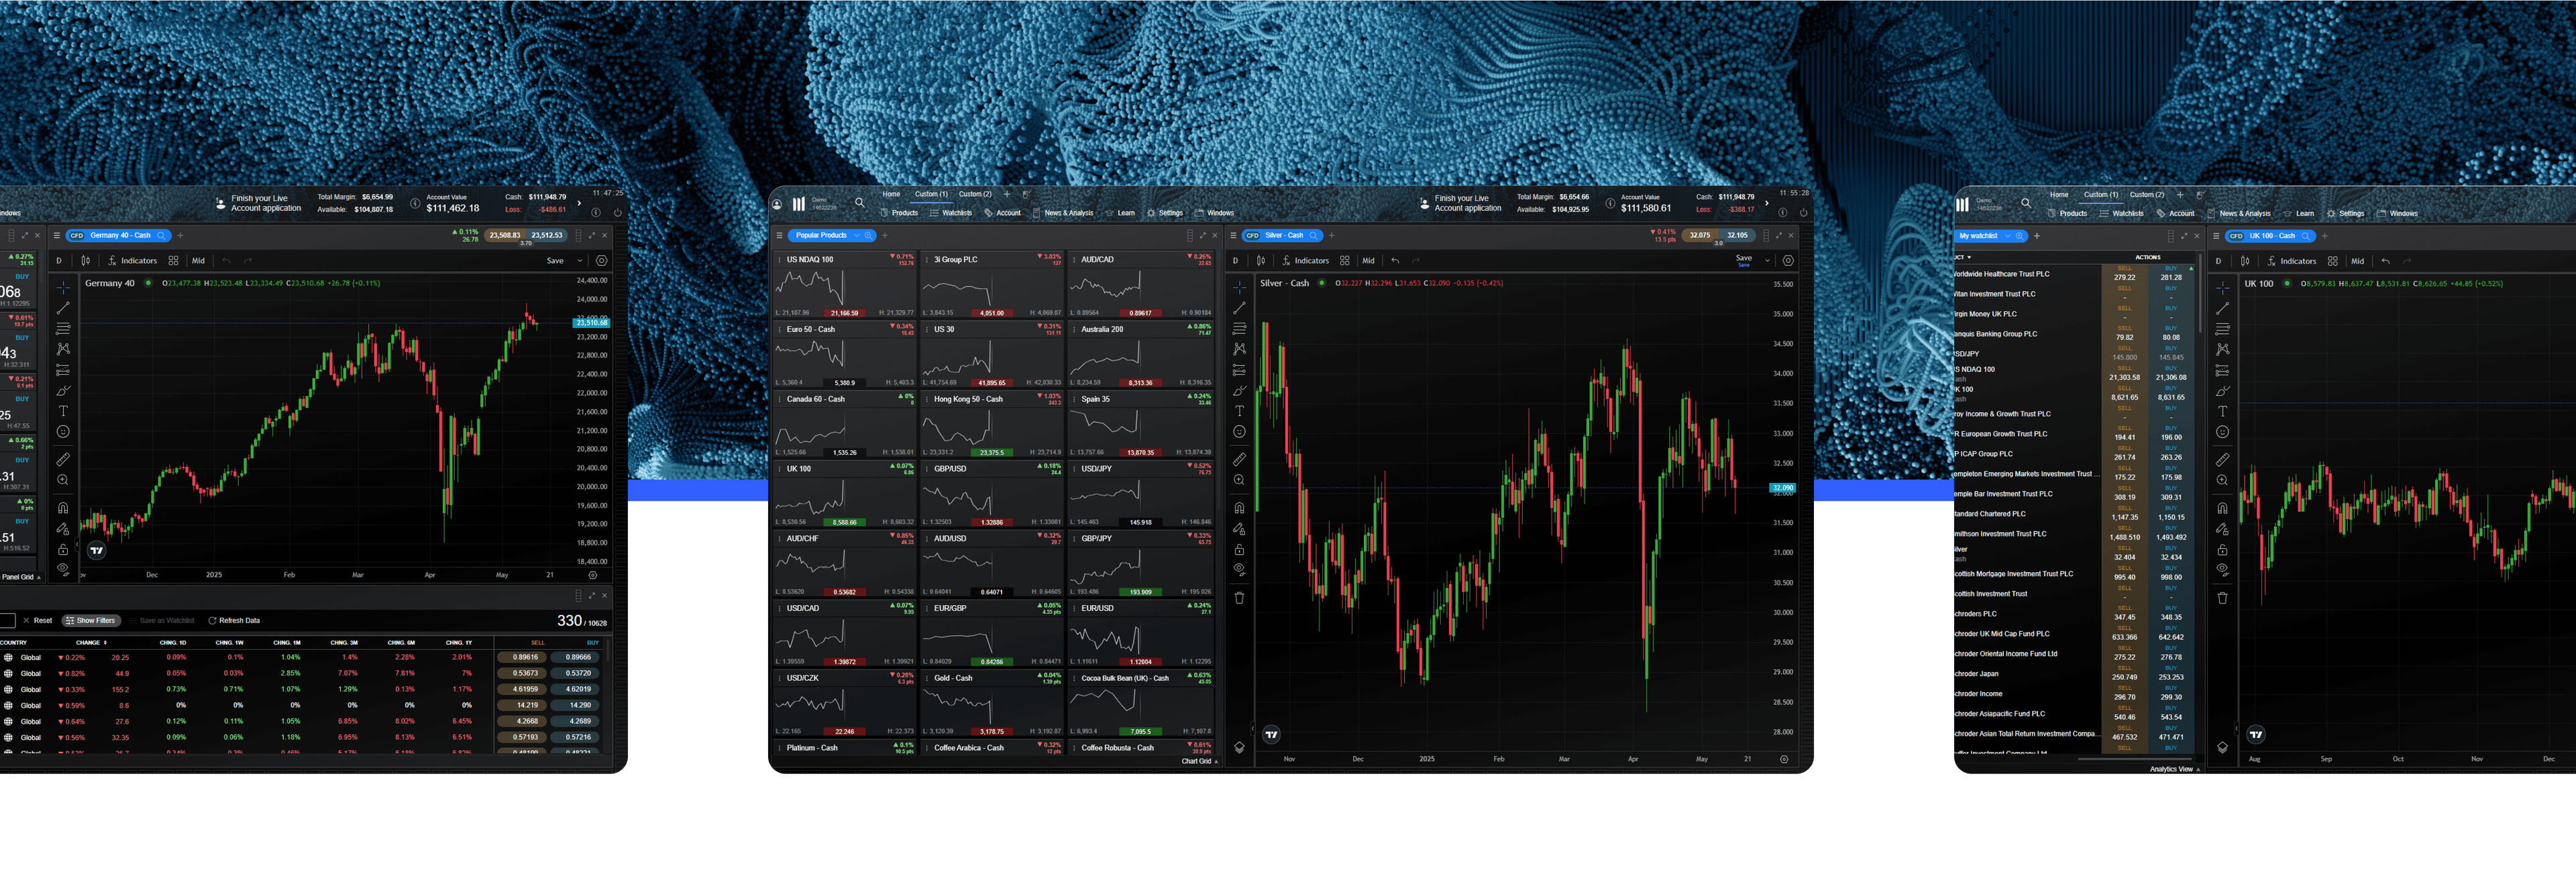
Traders are able to display breakouts, trendlines and reversal trading strategies through our online trading platform, Next Generation. Our award-winning platform* comes with a wide range of technical indicators, including Donchian channels, that you can customise to suit your trading personality and visual preferences. We also have multiple chart types for display, as well as drawing tools, pattern recognition software and a fully-integrated mobile app for traders on-the-go. Read more about our technical charting features here.

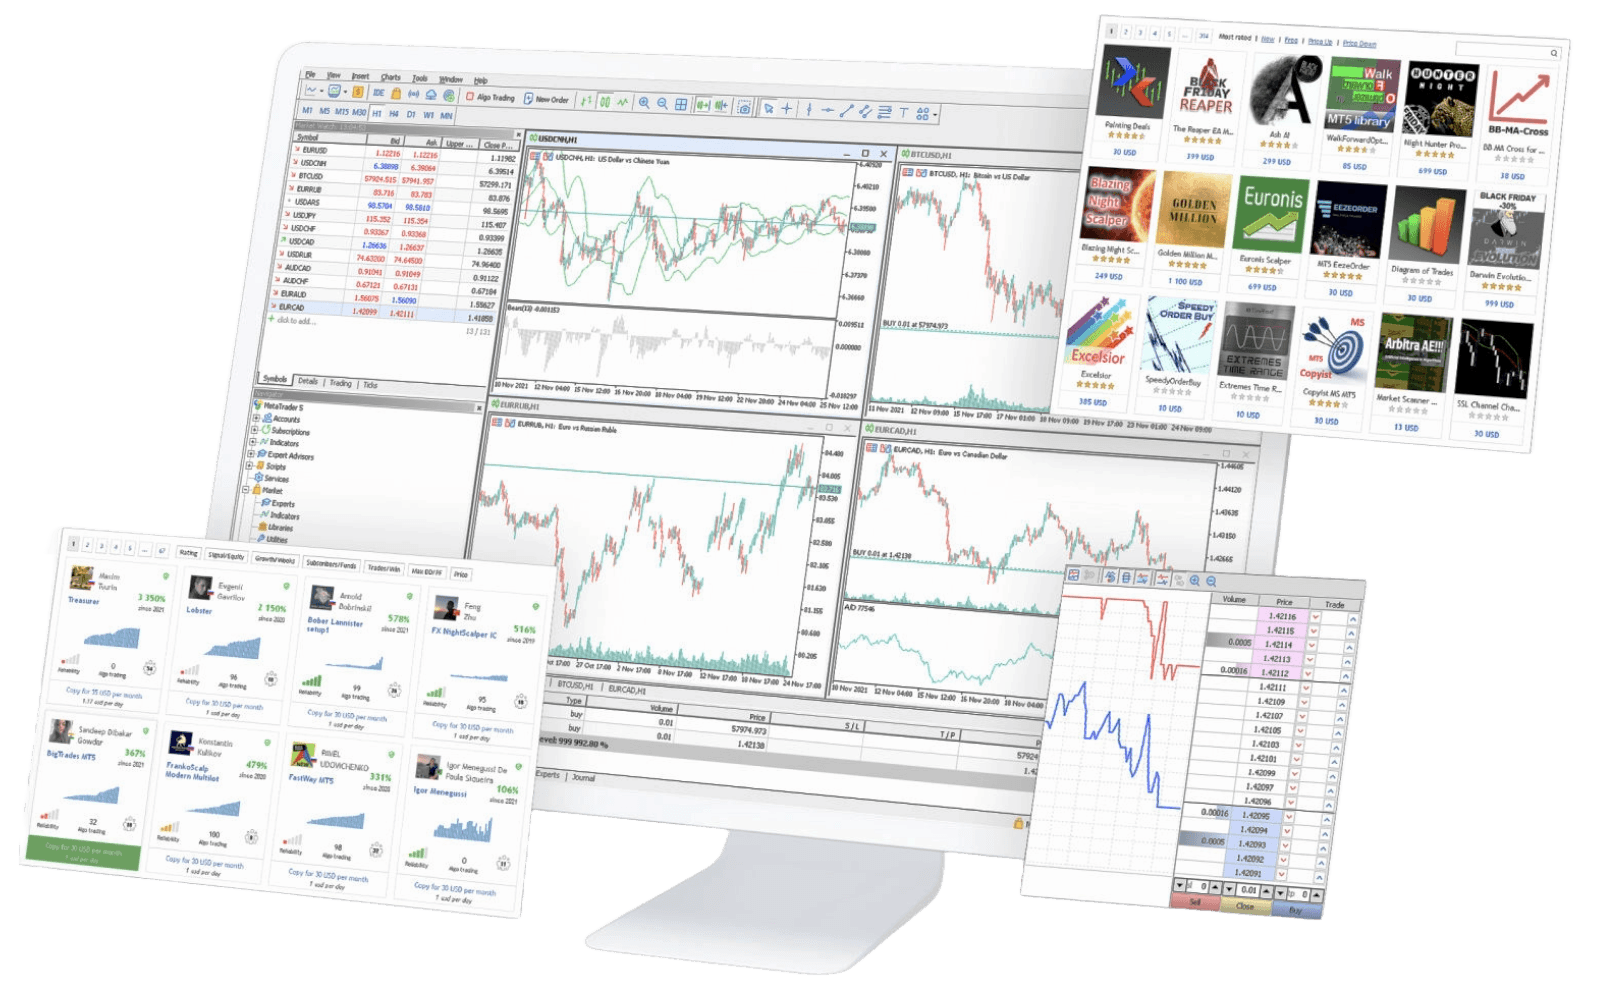
Donchian indicator on MT4

Donchian channels are also available to trade with on our hosted platform, the internationally established MetaTrader 4. The technical indicator is similar to our own, showing ranges of price movements and market volatility. View a full list of MT4 indicators and add-ons to download for your personal trading account and register for an MT4 account now.

Powerful trading on the go

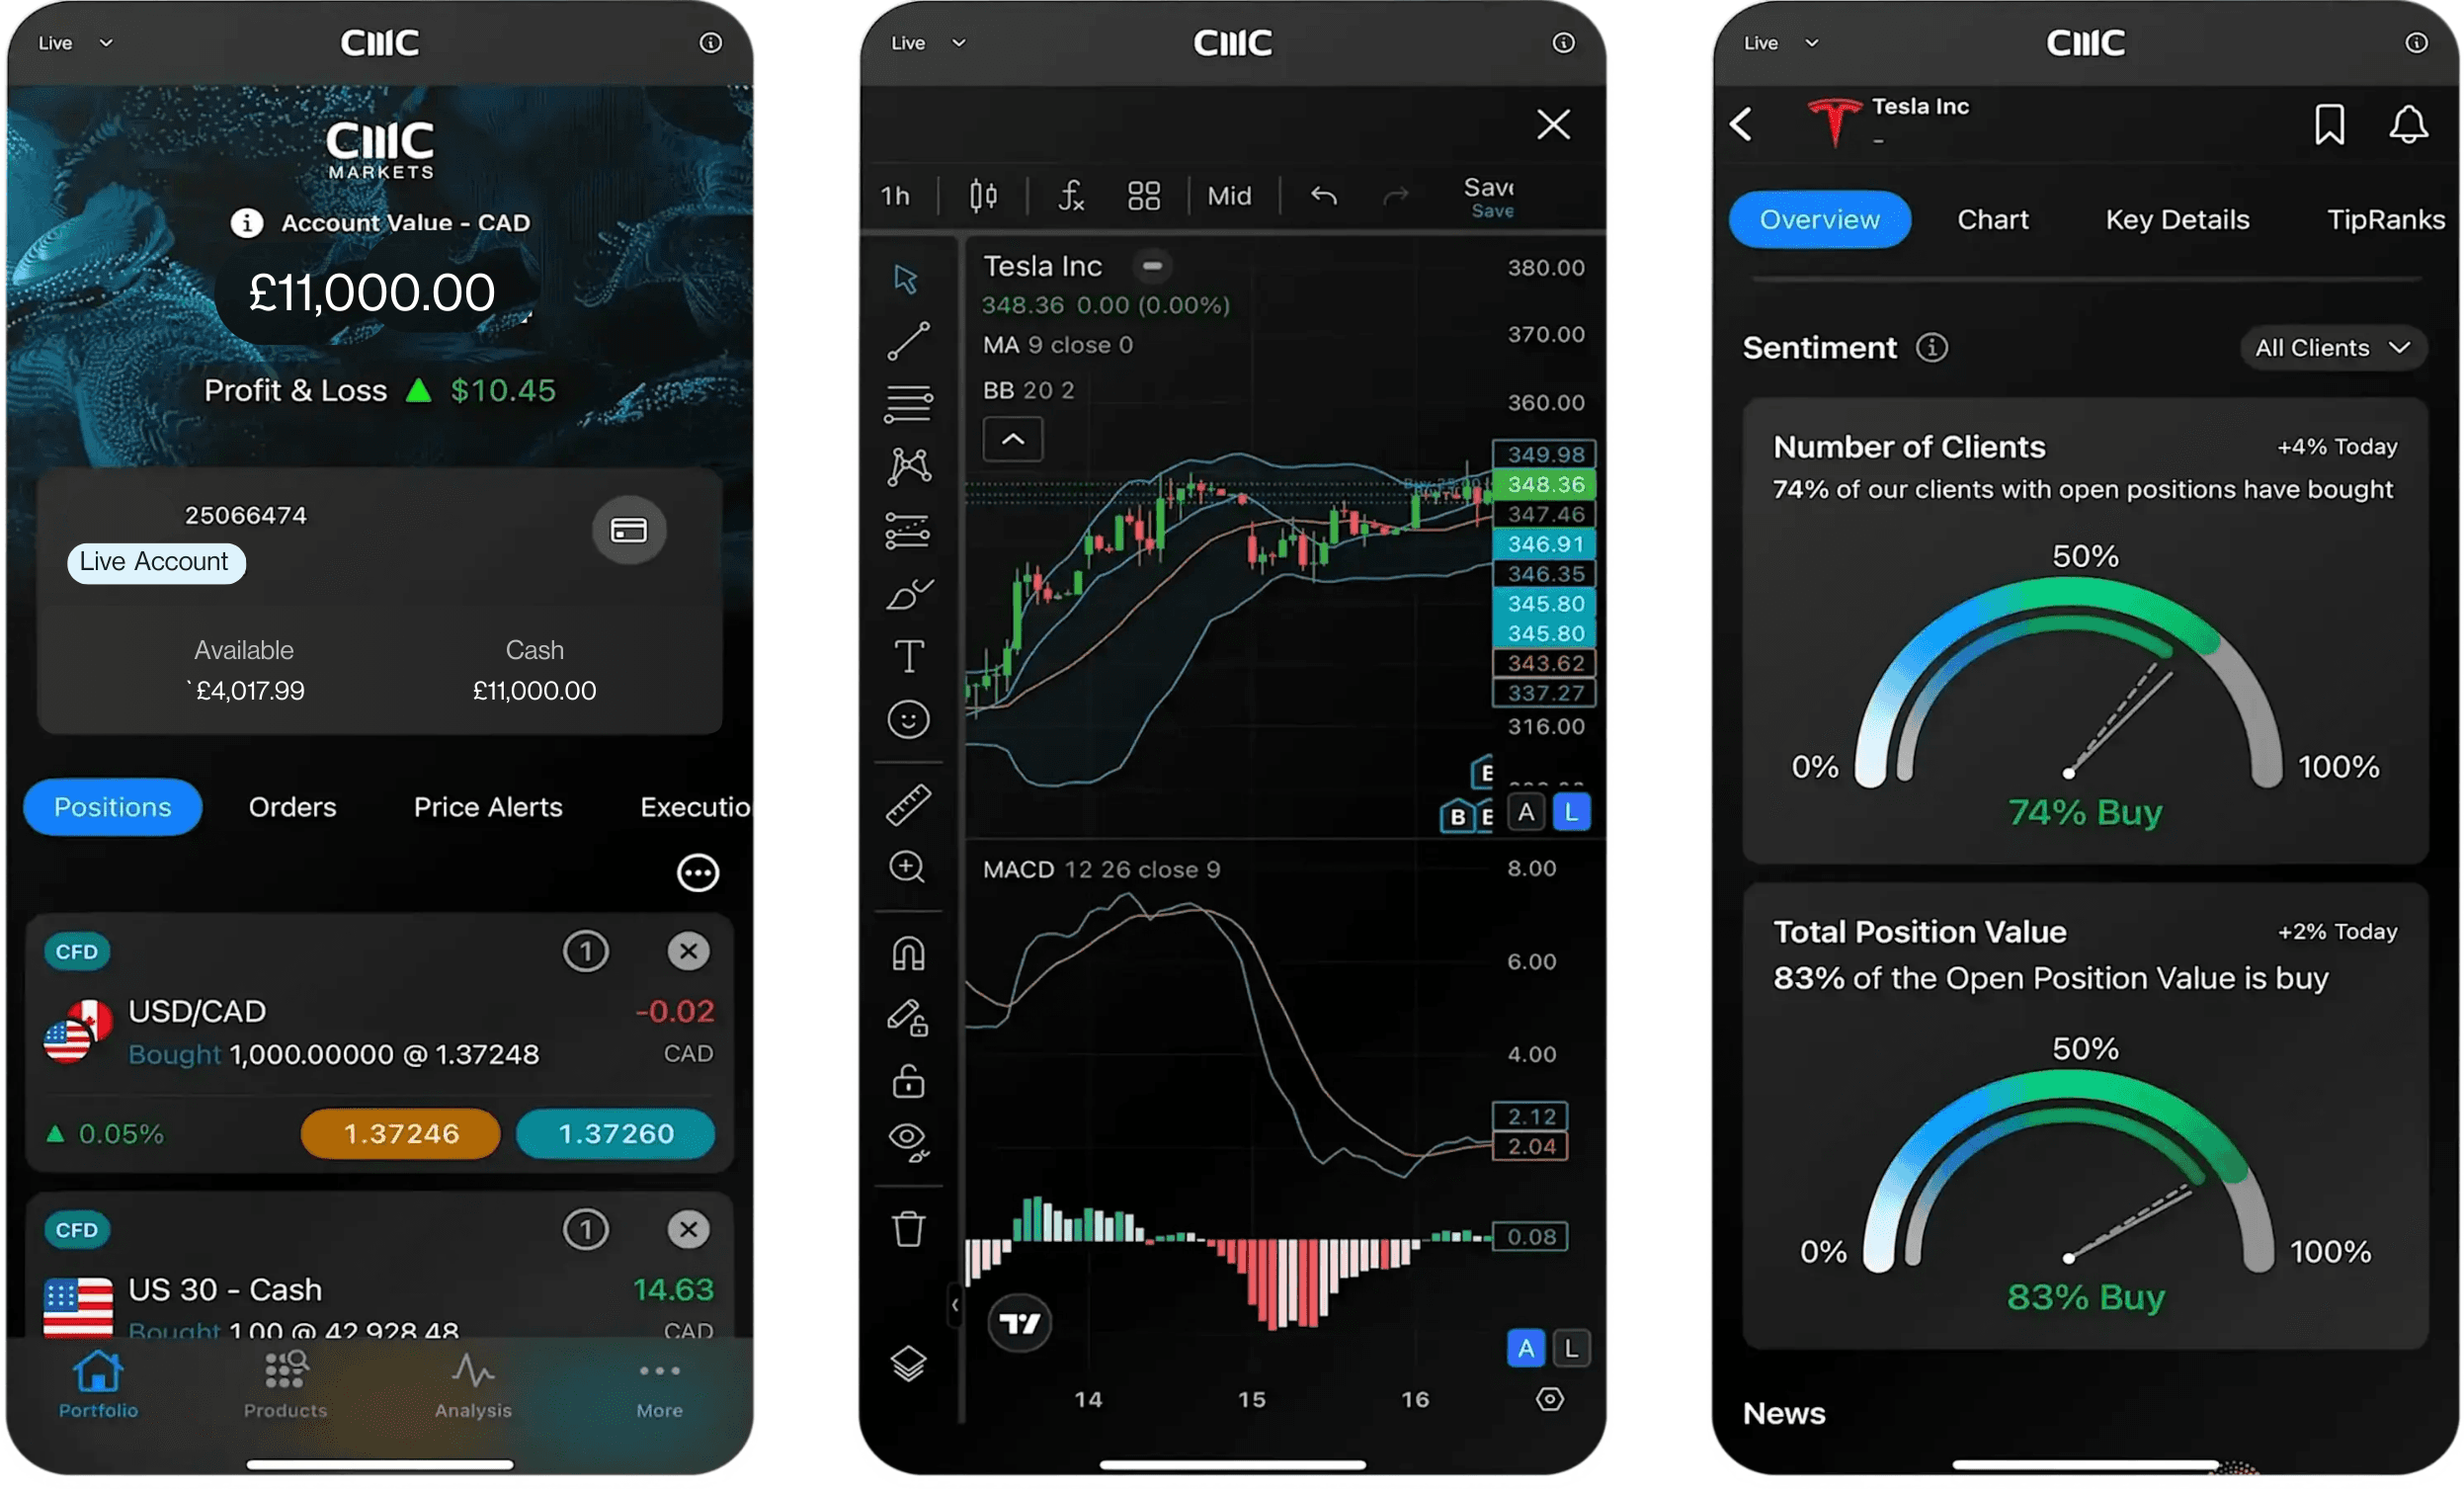
Seamlessly open and close trades, track your progress and set up alerts

*Awarded No.1 Web-Based Platform, ForexBrokers.com 2020; Best Overall Satisfaction, Best Platform Features, Best Mobile/Tablet App, Best Telephone Customer Service & Best Email Customer Service, rated highest for Charting, based on highest user satisfaction among spread betters, CFD and FX traders, Investment Trends 2019 UK Leverage Trading Report; Best In-House Analysts, Professional Trader Awards 2019.

Join over 275,000 other committed traders

1

Apply for a live account

Complete our straightforward application form and verify your account

2

Fund your account

Deposit easily via debit card, bank transfer or PayPal

3

Find and trade

One touch, instant trading available on 12,000 instruments

Hello, we noticed that you’re in the UK.

The content on this page is not intended for UK customers. Please visit our UK website.

Go to UK site