Spread bets and CFDs are complex instruments and come with a high risk of losing money rapidly due to leverage. 69% of retail investor accounts lose money when spread betting and/or trading CFDs with this provider. You should consider whether you understand how spread bets and CFDs work and whether you can afford to take the high risk of losing your money.

Economic indicators for event-driven trading

Trading with economic indicators is an investment strategy that helps traders to take advantage of past events, trends and predictions for the future of the financial markets. Many external factors can have an impact on the global markets, including interest rates, inflation and unemployment; the list is endless.

In this article, we look at some of the most important economic indicators in the UK, many of which originate from the US and can apply to countries worldwide.

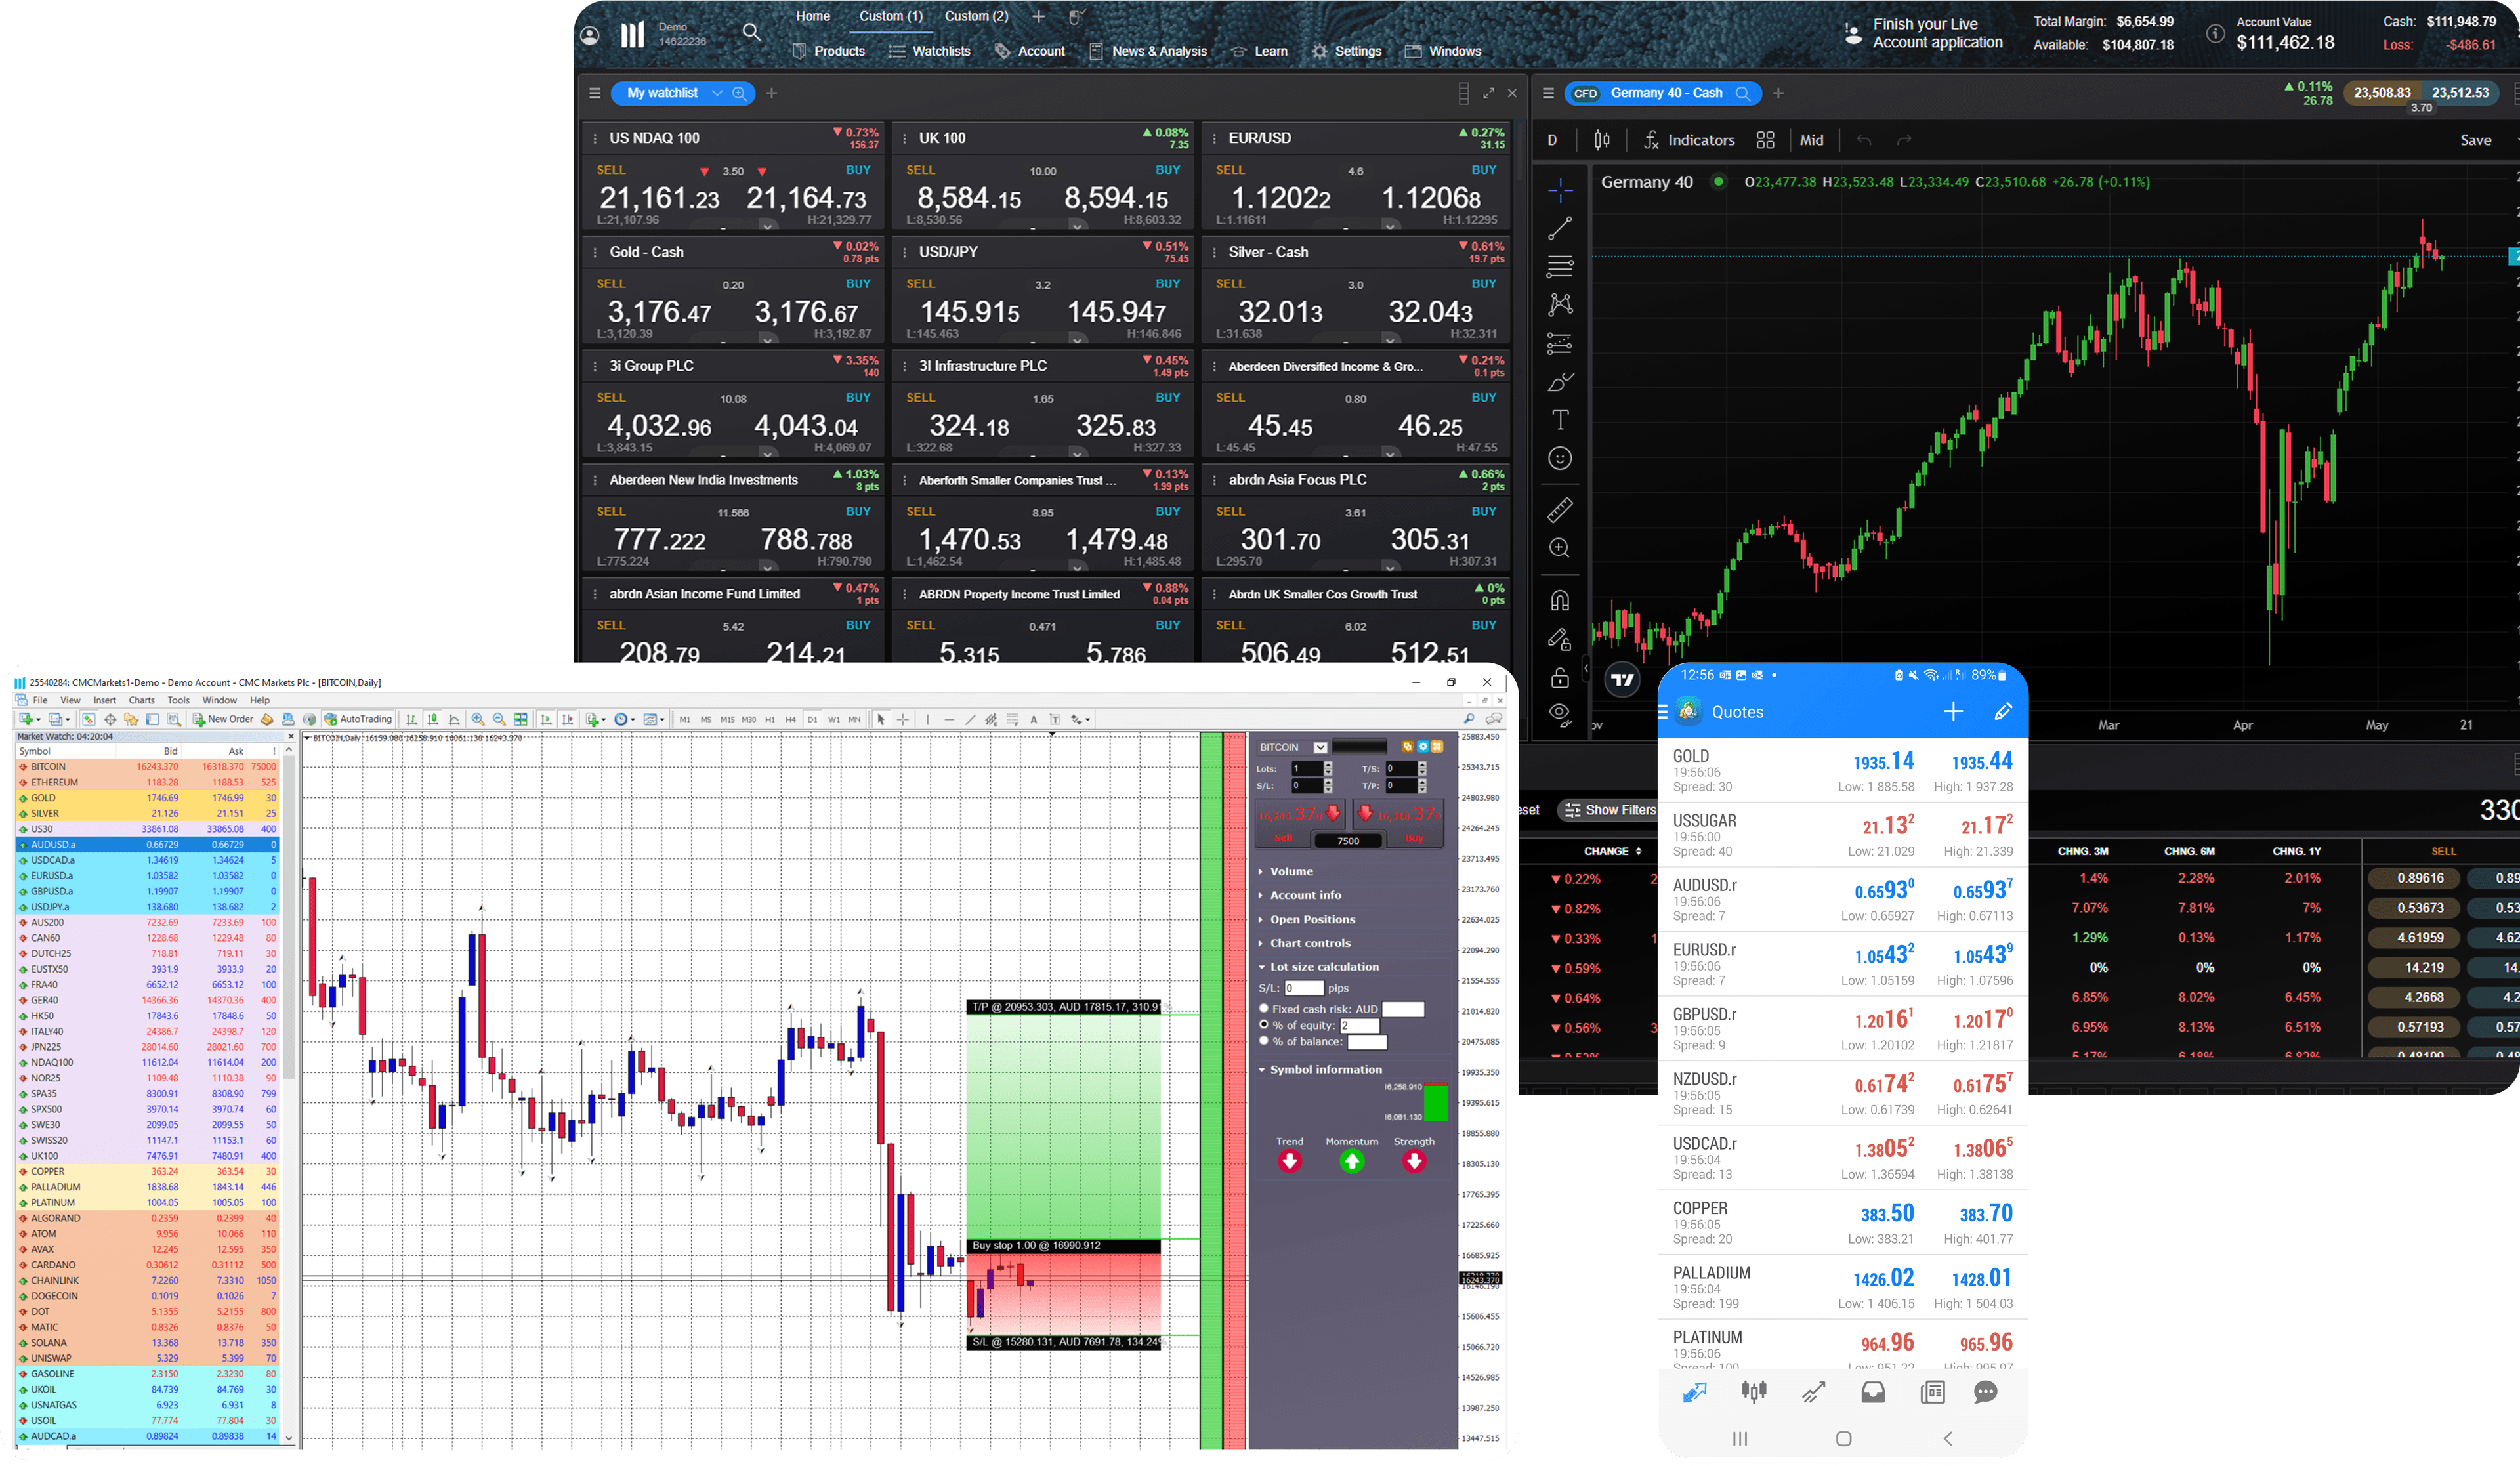
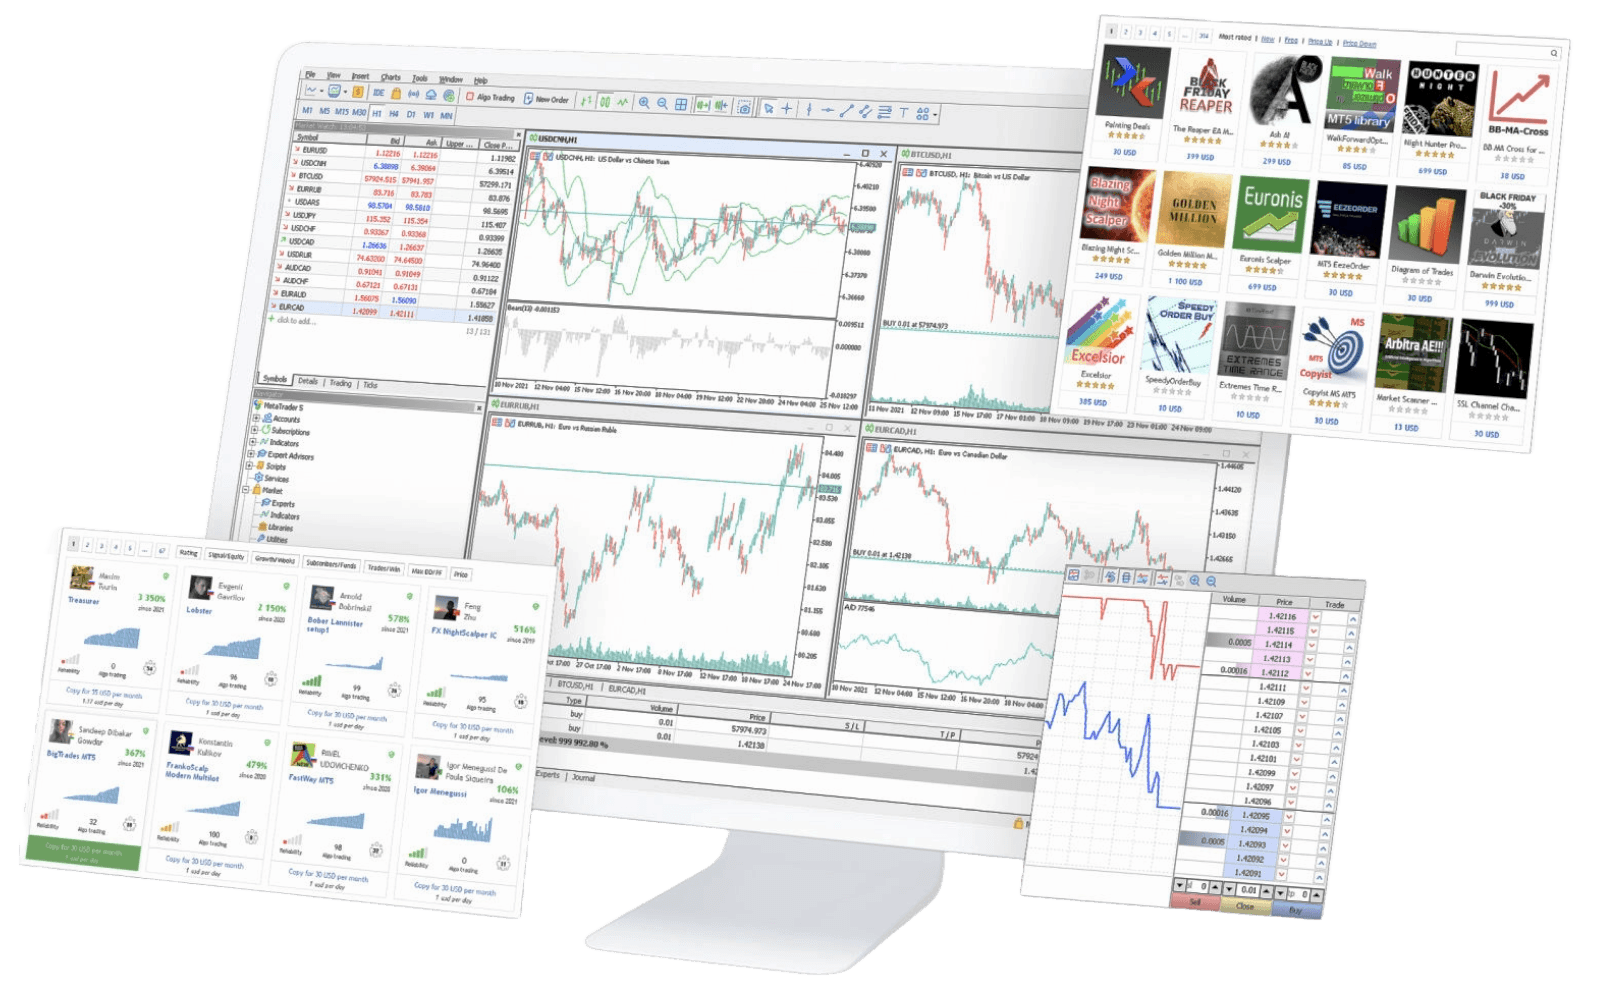
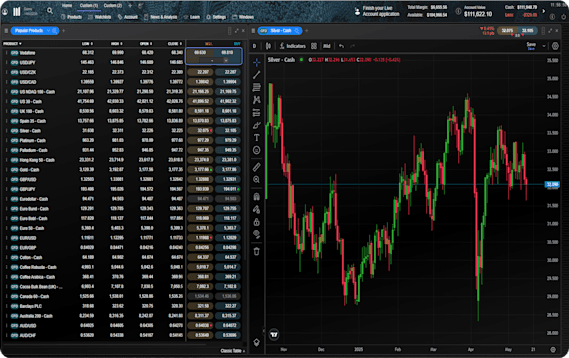
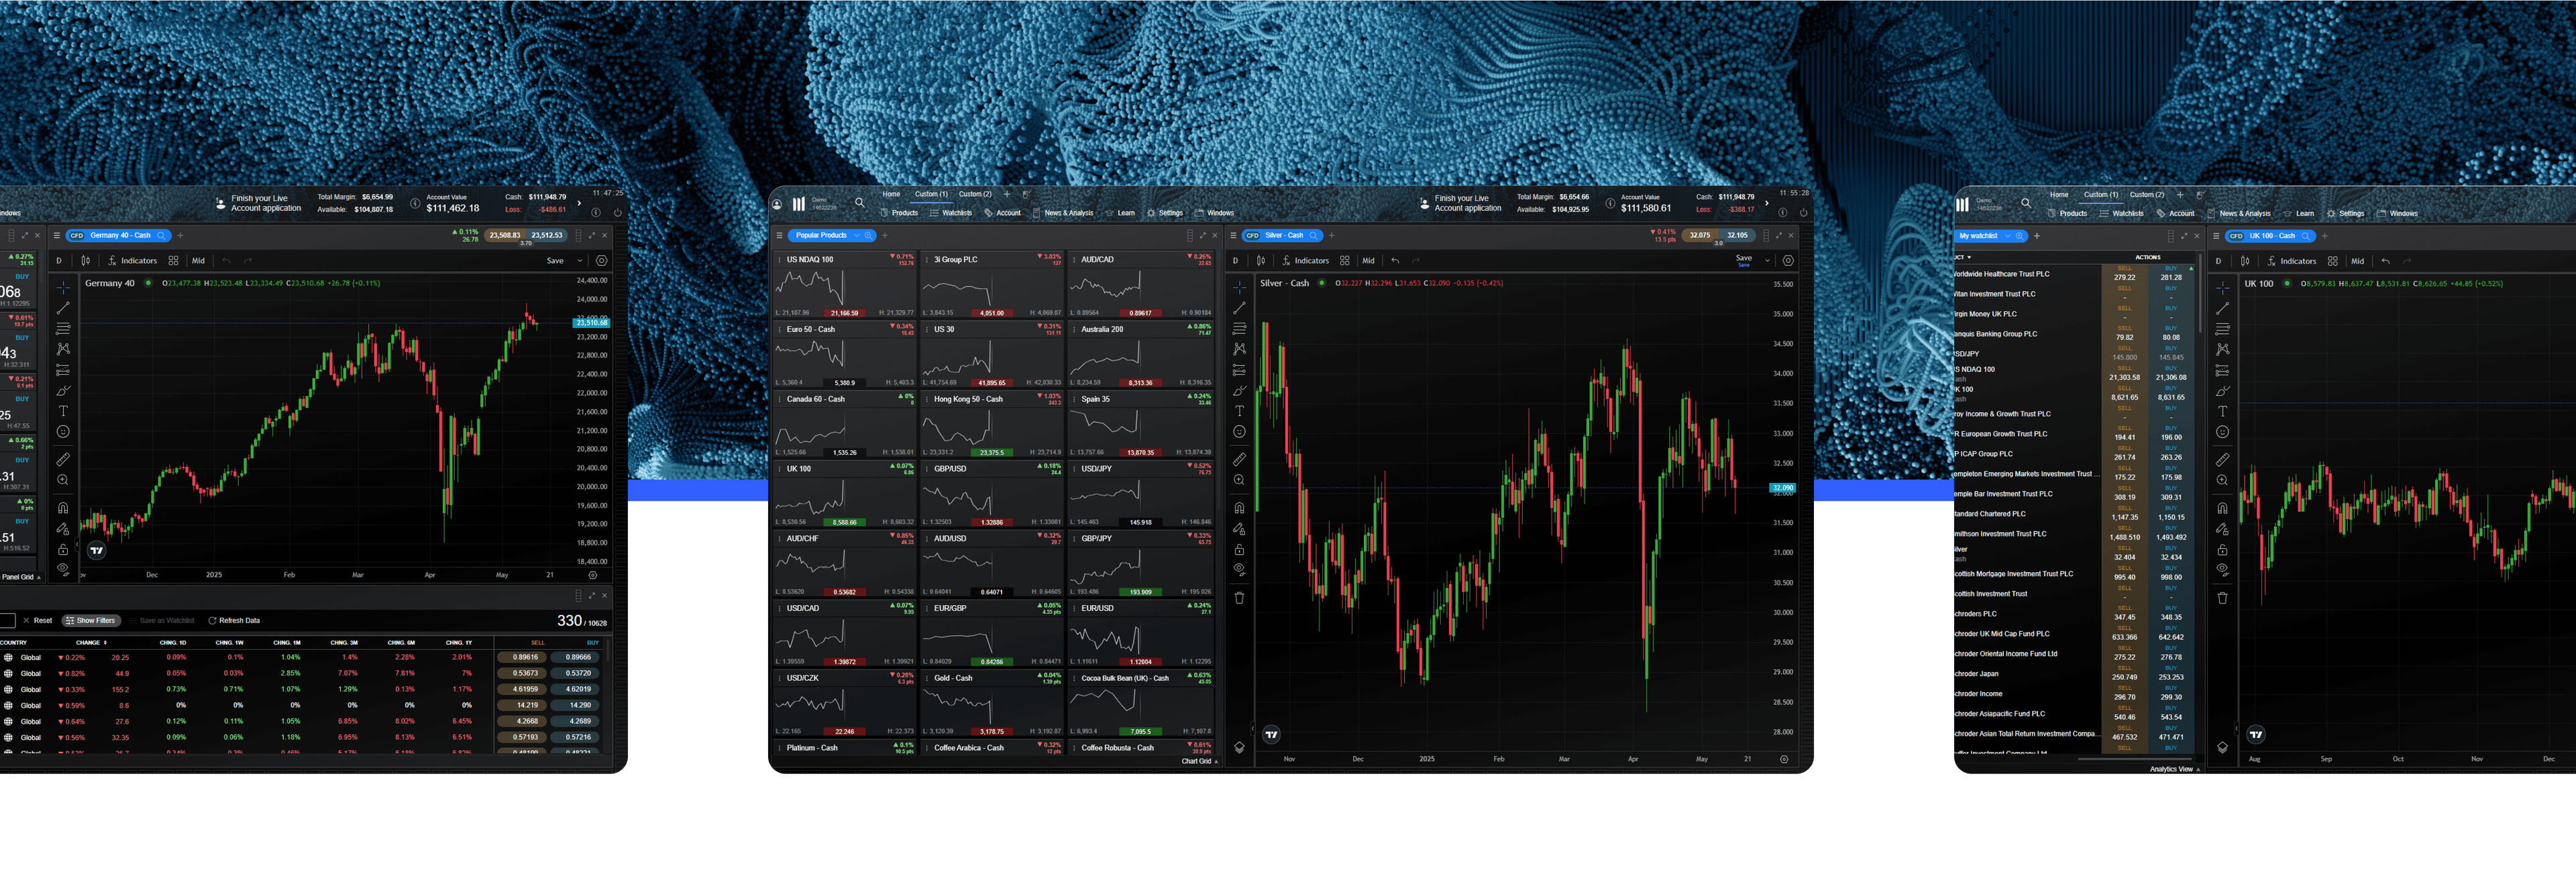
See inside our platform

Get tight spreads, no hidden fees and access to 10,000+ instruments.

Macroeconomic indicators​ help traders to understand what is happening within the markets and the economy of their country. They are essentially a form of fundamental analysis​, which aims to assess the intrinsic value of a financial instrument that they are looking to trade. The price of this instrument can change based on corporate activity and governmental changes. It is important to analyse changes and trends within the markets to keep on top of your positions. Traders can use these economic indicators to their advantage and build an effective event-driven investing strategy.

Watch the video below to get started.

Economic indicators definition

Economic indicators can fall into two categories: ‘leading’ or ‘lagging’. Lagging indicators confirm long-term trends that have already happened within the financial markets and these are seen as more ‘output’ oriented indicators. On the other hand, leading indicators look toward future outcomes and events, and these are seen as more ‘input’ oriented indicators. Therefore, it is best to combine both types of economic indicator for a comprehensive trading strategy, in order to identify past results and make new predictions from them.

Some of the most important macroeconomic factors that affect the way traders and investors look at the financial market include:

  • Employment
  • Inflation
  • Consumer activity
  • Interest rates

Macroeconomic events can have an influence on traders and their event-driven trading strategies, including these listed below. Most economic indicator reports in the UK are published by the Office for National Statistics (ONS), which is regarded nationwide as the primary institute for statistics. These factors affect both developed and emerging economies. In the US, the Federal Reserve and the Federal Open Market Committee (FOMC) are usually in charge of managing the economy.

Leading economic indicators

ADP national employment report

This is one of the most closely monitored indicators of employment in the US after the non-farm payrolls and is highly regarded as a comprehensive measure of job creation in the country. An increase in this figure indicates rising employment and potential inflation pressures, which can lead to rate increases.

The ADP national employment report is released monthly. This measures the estimated monthly change in employment in the US, excluding the farming and government sectors.

Business inventories

Business inventories often reflect turning points in the state of the economy. Low inventories can mean the economy is about to flourish because businesses' stock rooms are empty and need to be replenished, in turn requiring higher production. High inventories combined with low sales indicate a slowing economy as wholesale orders lessen, slowing production.

Business inventory reports are released monthly and they measure the change in the value of unsold goods held by manufacturers, wholesalers and retailers.

Consumer credit

This report corresponds with a country's consumer confidence and spending. An increasing consumer credit figure indicates that lenders are feeling more comfortable with issuing loans, and consumers are more confident in their financial positions and are therefore more eager to spend money.

The consumer credit report is released monthly and measures the change in the total value of outstanding consumer credit that requires instalment payments.

Consumer price index (CPI)

The main measure of inflation in a country at both consumer and producer levels is the CPI. This is often used by central banks when deciding where to set the country's official interest rate, as well as indexing pensions, wages and benefits.

The CPI report is released monthly by the ONS. It measures changes in the cost of living and is calculated by tracking changes in the price of a basket of goods and services used by a typical household.

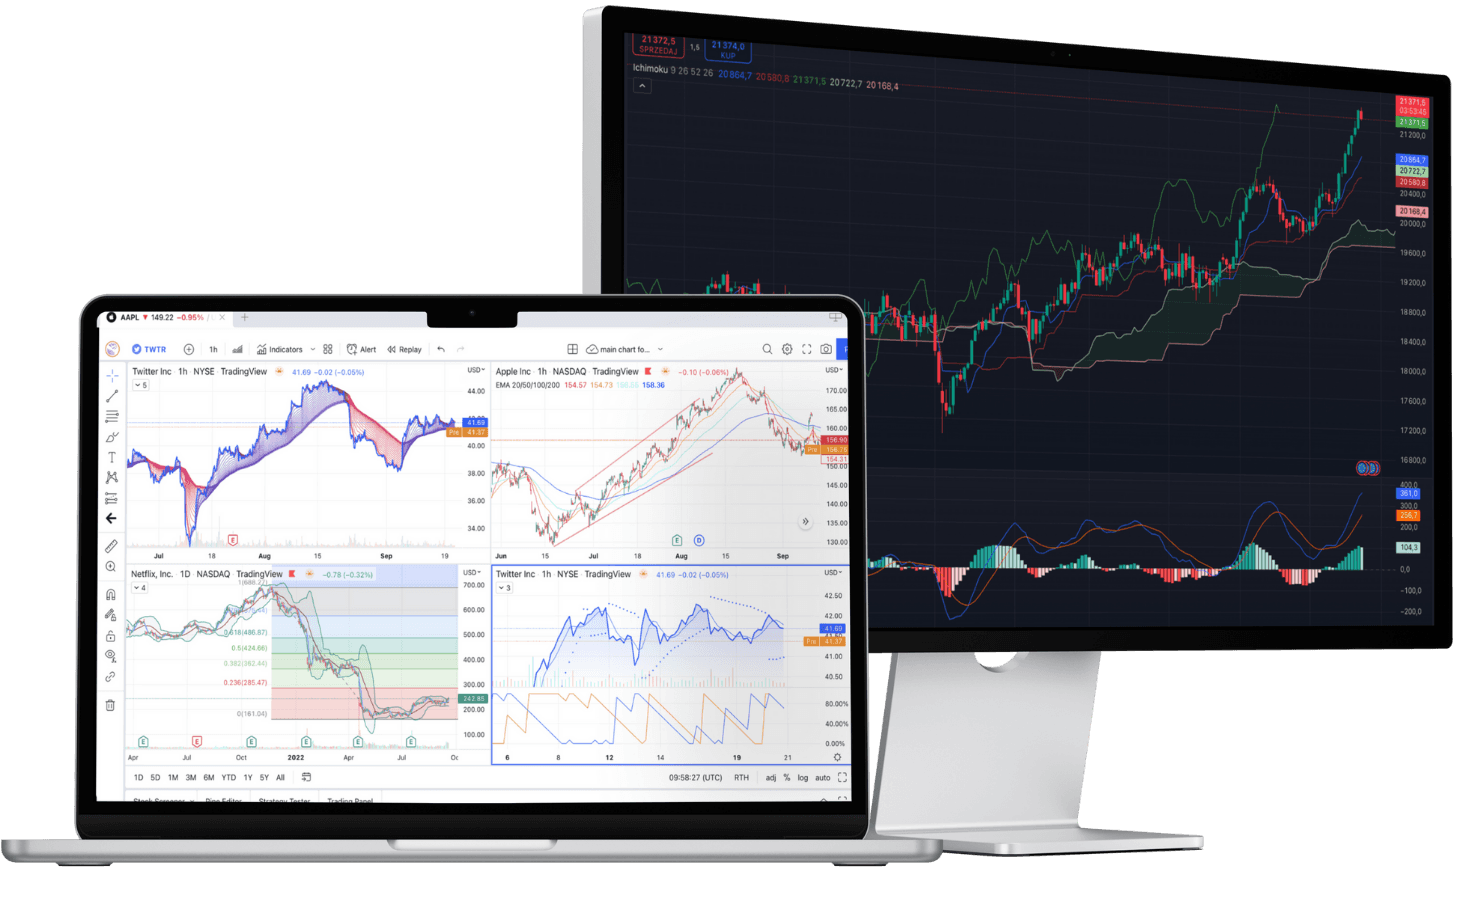
Carry out event-driven trading strategies

Current account

A positive value on a current account means that the flow of capital in a country exceeds the capital leaving the country. A negative value reflects a current account deficit, where there is a flow of capital out of the country. Ongoing current account deficits can lead to a weakening of the country's currency.

Current account reports are released quarterly and measure the flow of goods, services, transfer payments and income into and out of a country.

Gross domestic product (GDP)

So, which economic indicator measures economic growth? GDP reports are perhaps the broadest indicator of overall economic activity and growth. There are three versions of GDP released about a month apart: advance, preliminary and final. The advanced version tends to have the most impact on the market as it is the first to be released, whereas the final GDP is the change in the value of all final goods and services produced in the country.

The GDP report is released quarterly and measures the change in the value of all final goods and services produced in a country. Nominal GDP is also used to measure the world's strongest economies​​.

Import prices

This figure has an impact on inflation for both consumers and businesses that rely on imported goods and services. If the import price goes up, costs are passed on to these businesses and consumers.

Import prices are released monthly and measure the change in the prices of goods and services imported in a country.

Non-farm payrolls

This release measures the number of jobs added or lost in the US during a particular month. Agricultural jobs are excluded due to their large seasonal fluctuations. Non-farm payrolls​​ are a notable economic indicator, released on the first Friday of every month by the US Department of Labor. It represents the number of people on payrolls for all businesses, with the exception of agricultural, local government, private household and non-profit. The monthly figure can change significantly and this often leads to a high level of volatility in FX pairs, such as EUR/USD, around the time of the release. Generally, a high reading is seen as positive (or bullish) for the US dollar, while a low reading is seen as negative (or bearish).

Non-farm payrolls are released monthly, usually on the first Friday after the end of the month. They aim to measure the percentage of the total US workforce that was unemployed but actively seeking employment during the previous month.

Producer price index (PPI)

PPI rates give an early indication of inflation that consumers will face later, because this index analyses changes that take place before goods reach the retail level. When producers charge more for goods and services, these costs are usually passed on to the consumer. A rise in prices and inflation may lead to the increasing interest rates. A falling PPI may suggest an economic slowdown.

The PPI reports are released monthly and measure the change in the price of goods and services sold by producers in any country.

Retail sales

The retail sales figure is an important measure of consumer demand and spending. Increased retail sales mean higher retail output and economic growth, as consumer spending makes up a majority of the overall economic activity.

Retail sales reports are released monthly to indicate the change in the total value of sales by a country's retailers.

Unemployment claims

Employment is vital to the economy. If unemployment is up, consumer spending goes down and there is less demand for goods and services. Employment is a good indicator of an economy's health.

The unemployment indicator report is released weekly.

Trade on economic indicators

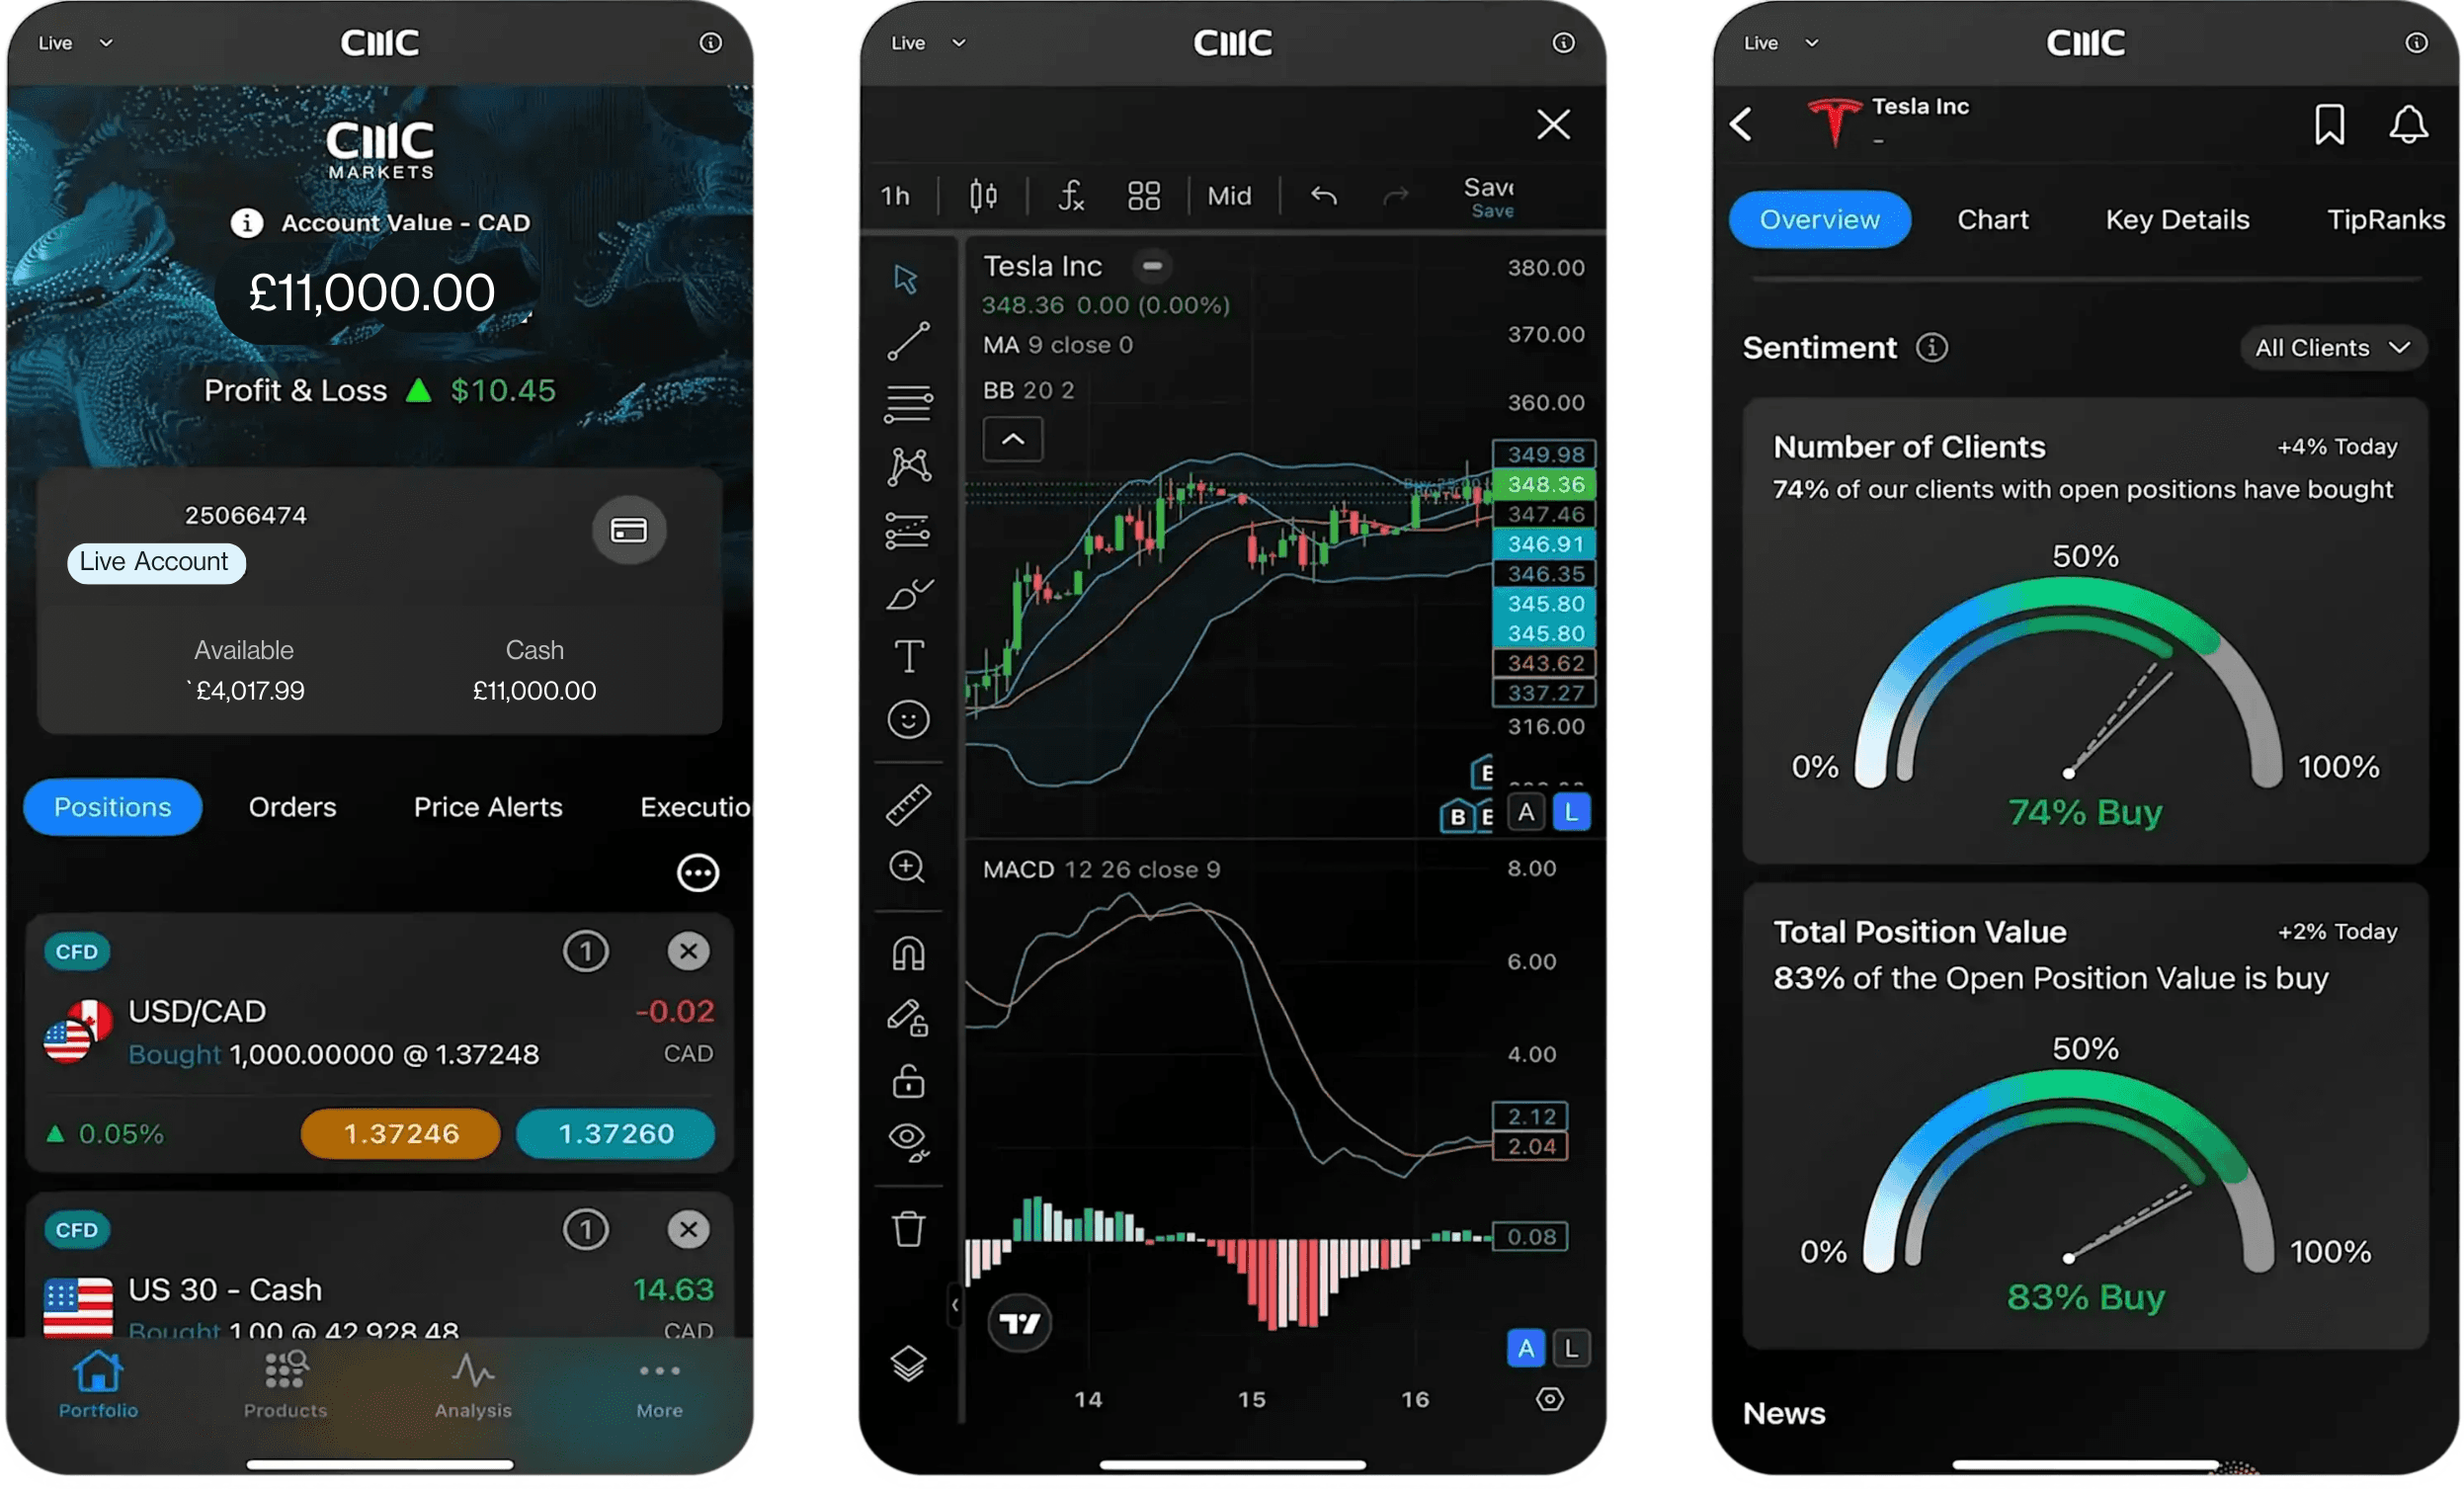
Seamlessly open and close trades, track your progress and set up alerts

Event-driven trading strategies

The above economic indicators can be applied when it comes to event-driven investing. As part of a global macro strategy, traders often look for opportunities within the financial markets after there has been a significant macroeconomic event.

For example, currency exchange rates and interest rates can have a huge impact on the forex market. Traders will analyse the relative strength of one currency against another and make decisions based on what they predict to happen, as well as analysing past trends. This explains the purpose of event-driven investing. In these situations, they may take advantage of short-term macroeconomic factors through forward contracts or other derivative products.

What are event-driven funds?

Event-driven trading can also help to take advantage of the stock market through private equities or hedge funds. Corporate events, such as mergers and acquisitions, bankruptcy and takeovers can lead to share price inefficiencies within the stock market. The hedge fund manager can open both long and short positions in an attempt to profit from the temporary inequality between prices. For example, a fund manager may purchase a share​​ that has a potential acquisition, and then sell if after the acquisition, when its price has risen to a higher figure.

Institutional investors​​ are the most common users of event-driven trading strategies, as they have the level of expertise ready to analyse high volumes of corporate events.

How to start event-driven investing in the global markets

  1. Open a CMC Markets account.
  2. Choose the macroeconomic indicators that you wish to monitor on our economic calendar.
  3. Analyse which indicators are most useful for the market that you are trading. For example, strong GDP data may indicate stock growth, whereas CPI and PPI are useful for inflation rates in forex.
  4. Keep an eye on leading and lagging indicators as both can prove useful when combined.

Trading with our economic calendar

Our online trading platform, Next Generation, displays a large number of economic indicators that may help you to make informed trading decisions. In particular, our customisable economic calendar offers real-time updates on macroeconomic events that are happening across the world.

Event-driven investing requires traders to keep a close watch on the global markets at all times, as factors such as interest rates and inflation can change very quickly.

Hello, we noticed that you’re in the UK.

The content on this page is not intended for UK customers. Please visit our UK website.

Go to UK site