Spread bets and CFDs are complex instruments and come with a high risk of losing money rapidly due to leverage. 69% of retail investor accounts lose money when spread betting and/or trading CFDs with this provider. You should consider whether you understand how spread bets and CFDs work and whether you can afford to take the high risk of losing your money.

Price action trading

The price of a financial asset, such as a share, currency pair or commodity, is essential to trading, as ultimately, it is the shift in price that produces profit or loss. Traders who choose to focus solely on price charts​ will need to develop a price action strategy that will involve analysing trending waves in order to ascertain when to enter or exit a position.

Understanding the mechanics of price action and developing a highly effective price action trading strategy has the potential to be highly profitable. In this article, we explore the techniques and indicators that will help in building this strategy.

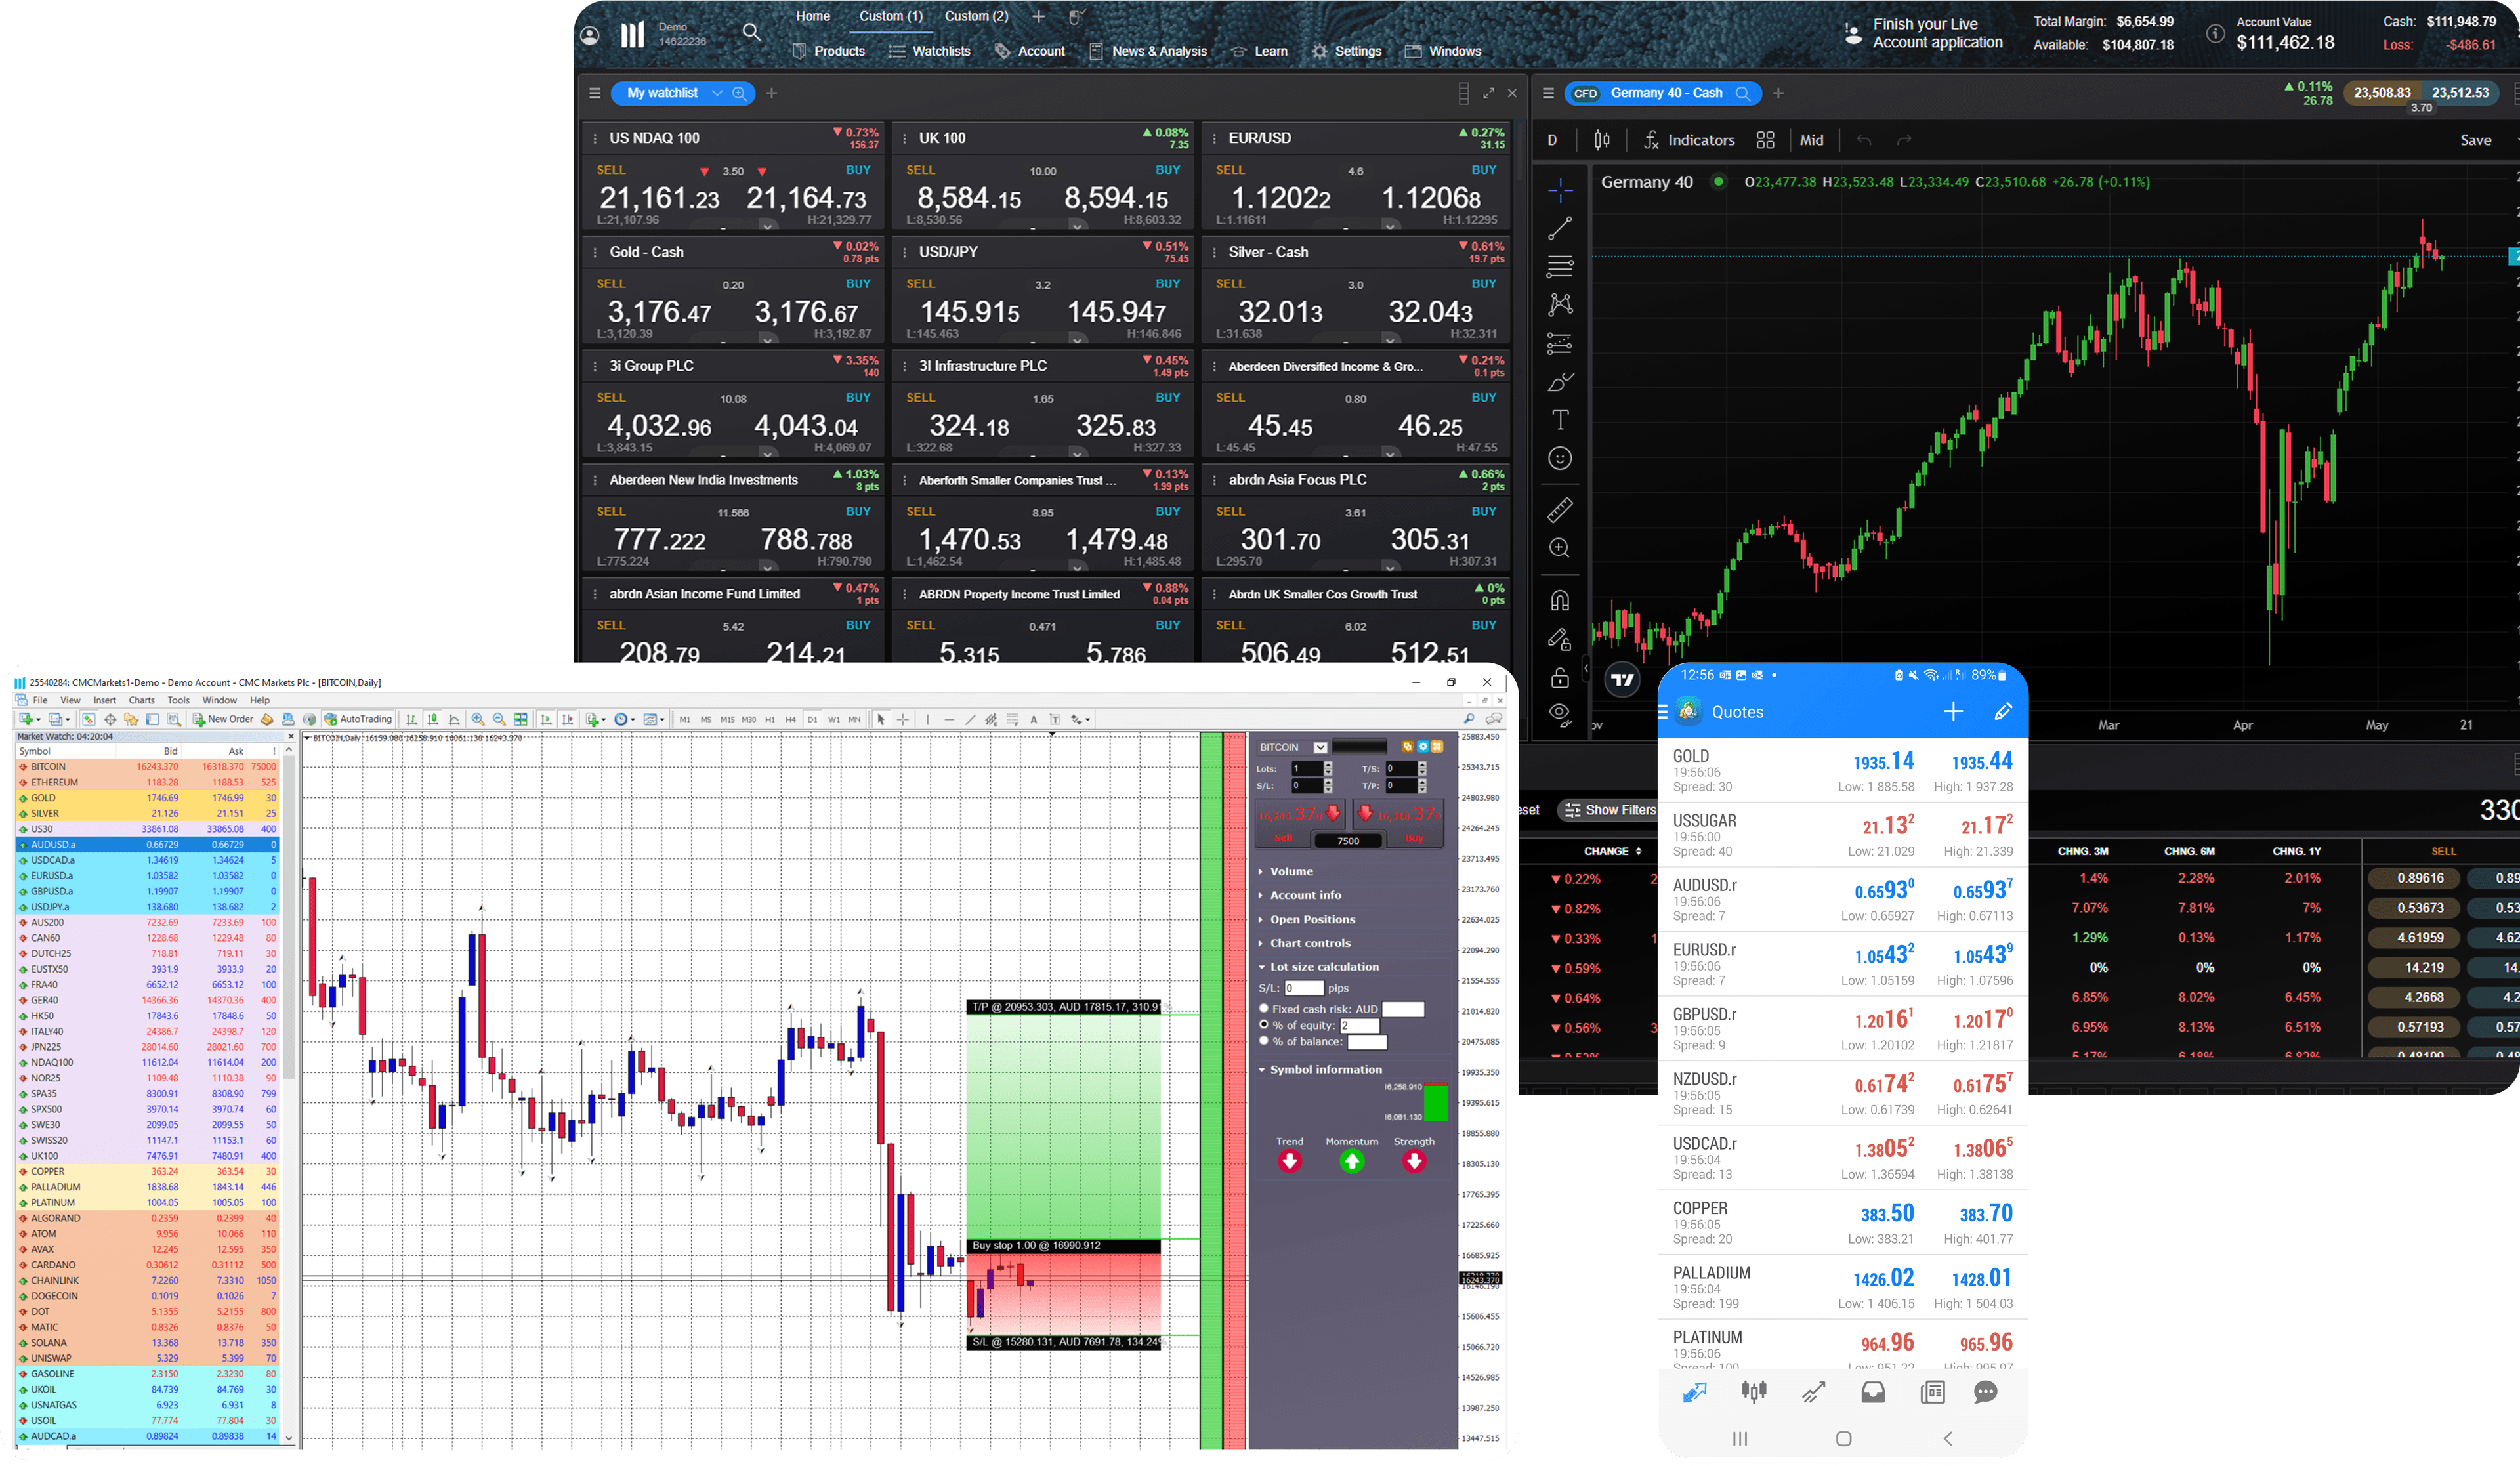
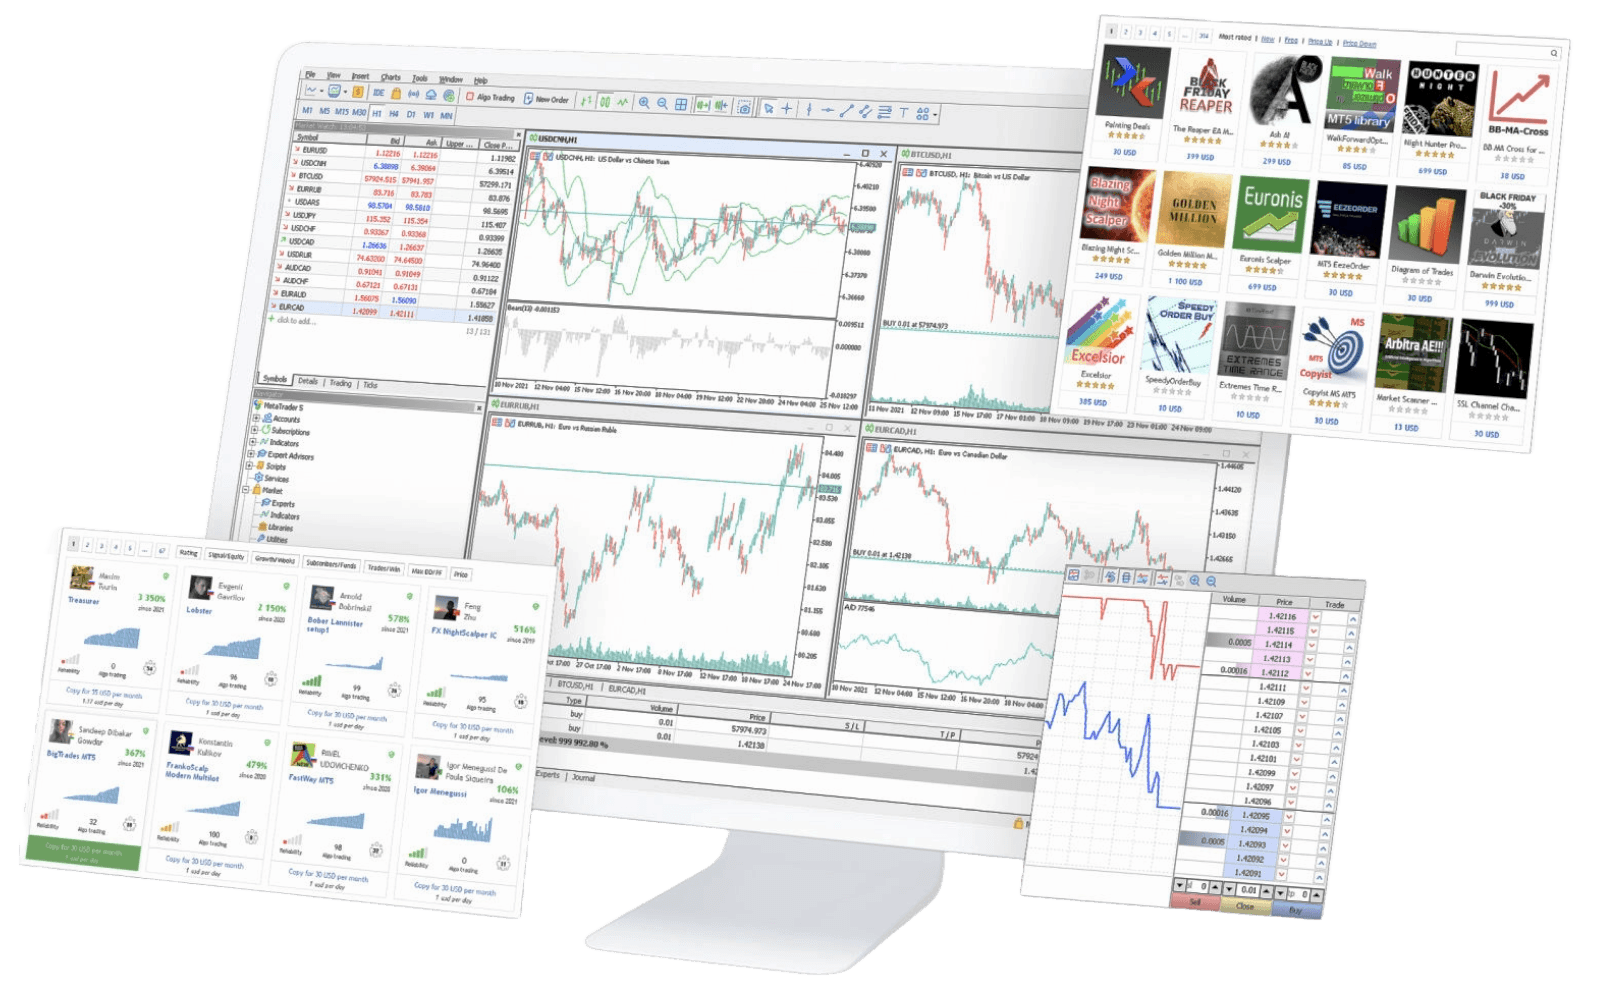
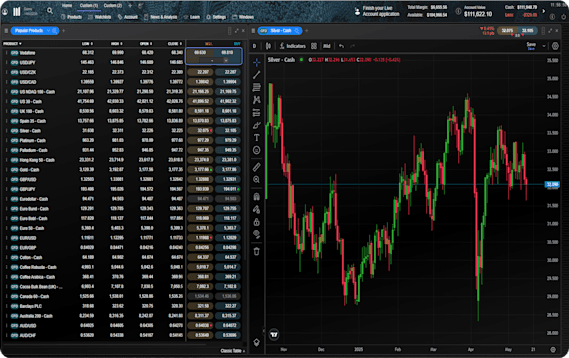
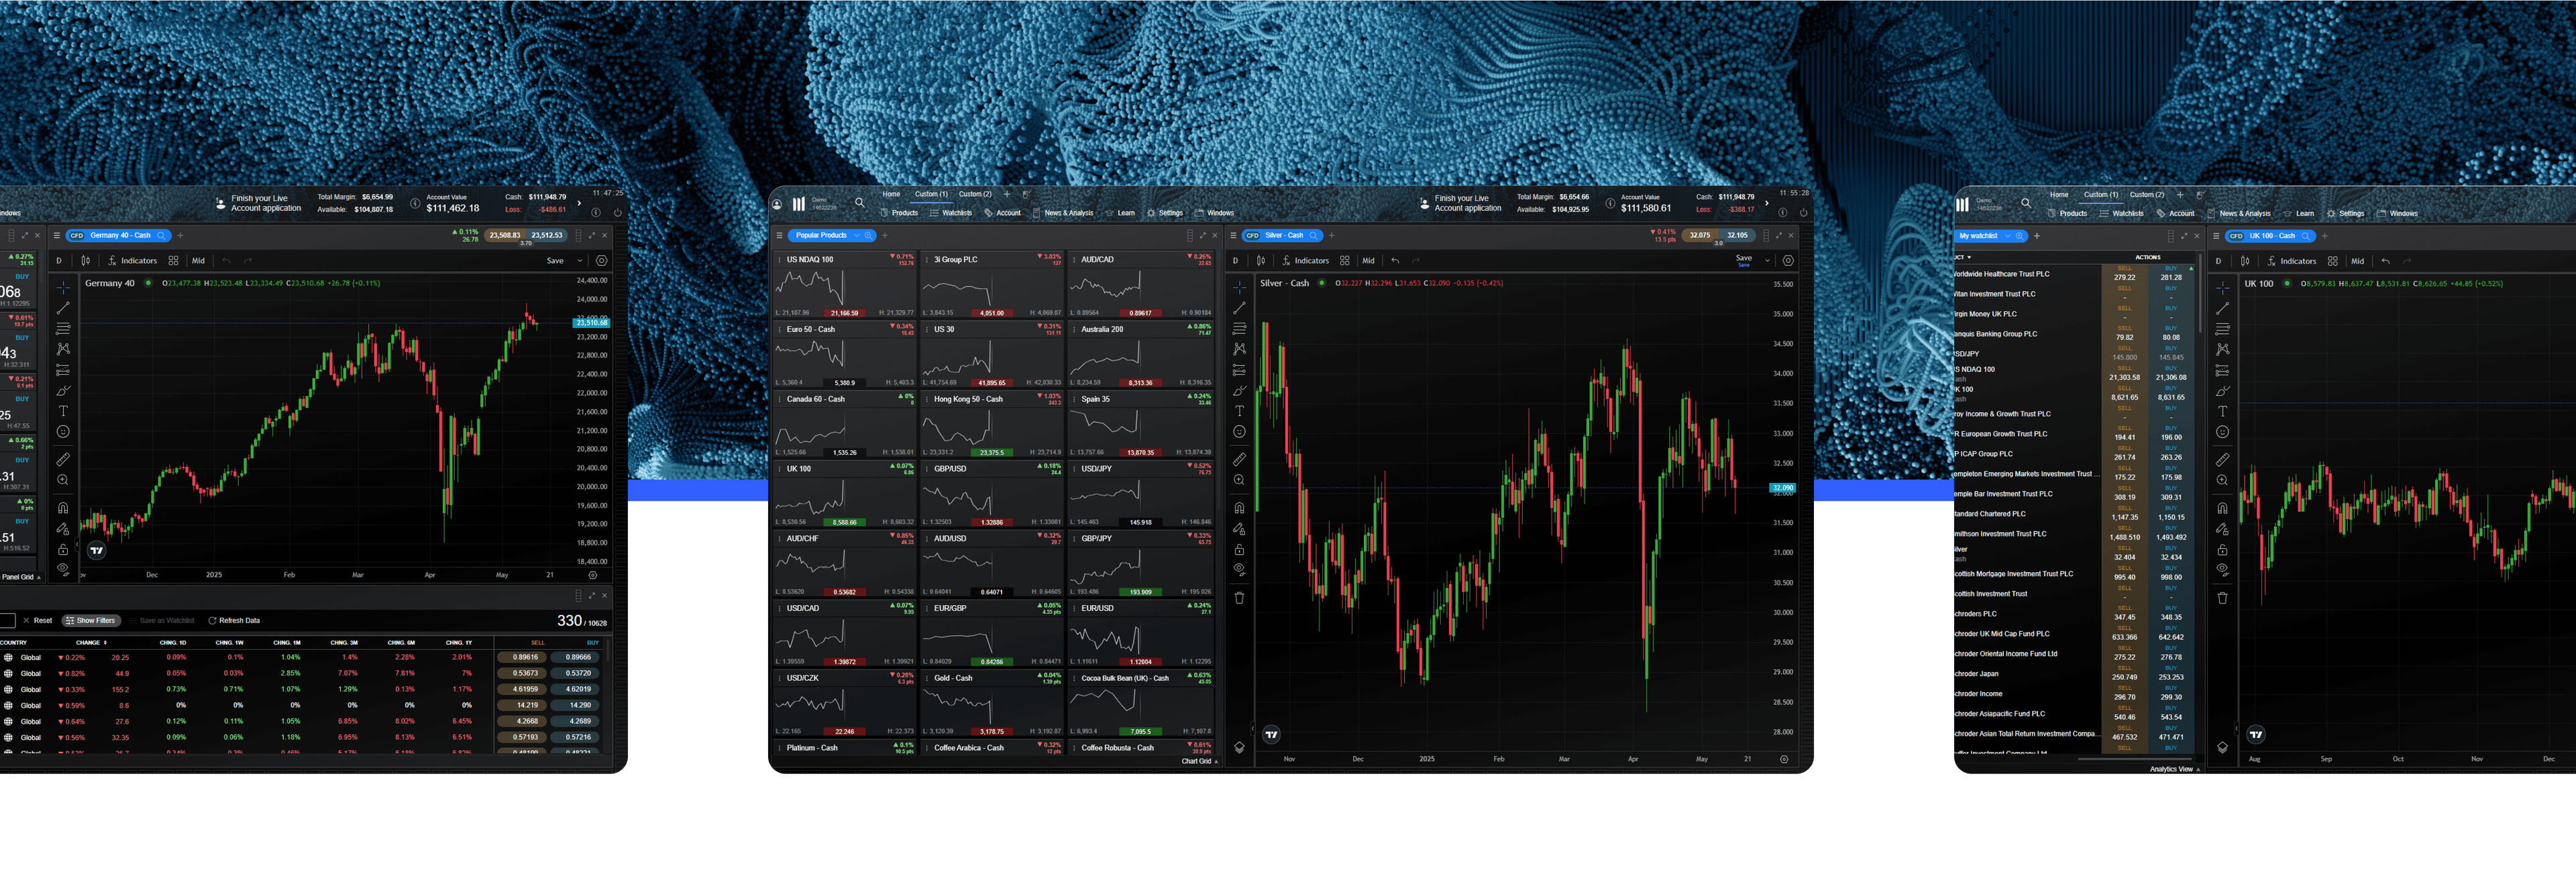
See inside our platform

Get tight spreads, no hidden fees and access to 10,000+ instruments.

What is price action?

Traders who focus solely on the price of an asset to make their trading decisions are using a “price action” strategy, which is an important part of technical analysis​​. A security’s price is one of the ultimate indicators of success — after all, price movements within the financial markets produce profits or losses. Get started with price action trading by listening to our podcast below with American author and technical analyst, Brian Shannon.

How to read price action

Trading on price action involves analysing trending waves and pullback waves, also known as impulse and corrective waves. A trend makes progress when the trending waves are bigger than corrective waves.

Traders monitor “swing highs” and “swing lows”, or the length of the trending and pullback waves, to identify the direction of the trend. During an uptrend, the rules are that the price makes higher swing highs in price, and higher swing lows. The reverse is true during a downtrend. The troughs and peaks of trendlines​​ float between lines of support and resistance​​ on a price chart.

The following Amazon (AMZN) candlestick chart has lines overlaid to demonstrate the major up and down waves and help highlight the downtrend and reversal to uptrend.

Price waves can also form patterns, such as ranges (equal size waves up and down), triangles (price waves getting smaller and smaller), and expanding ranges (higher swing highs and lower swing lows).

Trends and patterns compose the basic building blocks of price action trading. In addition, traders also watch for supply and demand levels and patterns on candlestick charts​​​.

Price action in forex

Price action trading is the same across all markets, even forex trading​​. There are some nuances to be aware of though. Currencies trade 24 hours per day, yet some forex pairs are less likely to move when their respective markets are not open, even if a price action signal develops. Therefore, this article contains examples from all markets to demonstrate how price action trading works, whether it be for the forex, share, index or commodity markets.

How to trade supply and demand with price action

Supply areas are seen where sellers have entered the market aggressively and caused the price to drop, and it has not returned. Traders watch out for these because, when the price returns, sellers may still be present and ready to sell again, pushing the price back down.

Demand areas occur where buyers have entered the market aggressively. The price rallied and has not returned. If the price returns to that level, traders will be watching to see if the buying picks up again, pushing the price back up.

Price action trading patterns

Price action continuation patterns

Continuation patterns occur during a trend. Assume the trend is up, and a triangle forms. Because of the uptrend, the price has a slightly higher chance of breaking out to the upside because the trend is up. The same concept applies during a downtrend when a pattern forms. The strategy here is to wait for a trend to form, and then wait for a pattern, and then only trade if the price breaks out of the pattern in the trending direction.

Here is an example using silver.

Price action reversals

Price action reversals occur when the rules of an uptrend or downtrend are violated. Once one of these basic rules is violated, the trend is in trouble. If both rules are violated, the trend will reverse based on the waves being viewed.

Consider an uptrend that is making higher swing highs and lows. When it makes a lower swing low, this is a warning sign. If the price then makes a lower swing high as well, this means that a reversal is underway. This does not mean that things cannot go back the other way, allowing the uptrend to resume. The evidence simply indicates that a reversal is likely to happen. The below Tesla [TSLA] chart shows a price action reversal from uptrend to downtrend, and then back to an uptrend.

Read more about stock chart reversal patterns​​ here.

Advanced price action strategies

Price rejection trading strategy

Price rejection is when the price tries to move through an important level, but then reverses direction because there is not enough force to maintain the trading momentum. Rejections often result in hard and fast moves in the opposite direction. Here is what to watch out for:

  • Price approaching a key price area (supply, demand, or pattern breakout area).
  • Price nears the area or even breaks through it marginally.
  • The price momentum fails and price moves in the other direction.
  • The candle typically has a long tail.
  • Price moves back the other way, providing an entry opportunity.

The EUR/USD supply and demand chart below provides several examples of a price rejection. In all cases, the candles had long tails, which indicate the last failed attempts to breakout.

Analyse price action for 10,000+ instruments

Renko price action strategy

Renko charts​​ form bricks, where each new brick appears once the price has moved a specified amount. Bricks only occur at 45-degree angles and they stay the same colour until a reversal occurs. A reversal is when the price moves two-bricks in the opposite direction.

Renko charts work well in trending markets. If the Renko chart stays the same colour and the trend continues, traders should stick with the trade. But if it reverses, then it may be time to exit the position. The Tesla chart we previously looked at has been recreated below, using Renko blocks. They would have kept the trader in for the entire rally starting in March.

Price action scalping strategy

Scalping is a trading strategy where profits and losses are taken quickly, as trades typically last a few minutes or less. In forex scalping​​, this may mean using a 3 to 5 pip stop loss and a 5 to 10 pip target. In the share market, it may mean risking a few cents a share in or order to make a few cents. Scalping involves entering and exiting a position quickly to take advantage of small price movements, for whatever a small price move is considered to be for that asset. Many scalpers typically use 1-minute charts.

A scalping strategy​​ aims to trade in the trend direction and enter during a pullback when the price starts moving back in the trending direction. To do this, traders look for engulfing patterns to signal an entry, such as when a candle in the trending direction envelops a candle in the pullback direction. This occurs during a pullback.

Below, arrows mark the engulfing patterns that signal potential trade entries on the Alcoa [AA] 1-minute chart. While this is one example of a scalping strategy, all the prior discussed strategies and concepts could be used for price action.

Price action strategy for swing trading

Any of the price action strategies mentioned above can be used as part of a swing trading strategy​​. Swing traders typically use hourly, 4-hour, and daily charts to find trade setups, although they may use 15-minute or 5-minute charts to fine-tune their market entries.

Let’s look at a supply and demand example, coupled with trading with the trend. The USD/CAD chart below shows an overall downtrend on this 4-hour chart. As you can interpret, the price rallies, puts in a swing high, declines and then enters a short-term downtrend, before rallying back to the prior high. Given that the trend is down and the price has entered a supply area, this is a potential short trade.

If you were to let the price enter the supply area, it would often exceed the prior high. If you are hoping to short the stock​​, you could enter when there is a bearish engulfing pattern or the price consolidates and then breaks the consolidation to the downside. The arrow marks the breakout of the consolidation, to the downside in this case.

Stop losses and profit targets for price action trading

You can control risk by placing a stop-loss order​ on each trade. When buying and taking a long position, a stop loss goes below the recent swing low. When shorting an asset, you could place it above the recent swing high. In both events, this controls the risk of the price sinking too low, or rising too high. For Renko charts, you could exit when the bricks reverse direction and change colour.

Price action traders need to lock in profits. This can be done in a variety of ways. One of the simplest methods is to use a risk-reward ratio​​. For example, if the risking $0.05 per share on a scalp trade, exit at a $0.10 profit. That is a 2:1 risk-reward ratio. For scalping, 1.5:1 or 2:1 is common. For swing trading, 3:1 or higher is common, but traders can determine for themselves their desired risk-reward ratio.

Other exit methods include using price action itself. If you enter a trade because a downtrend has started, stay in the trade until the trend reverses. Price action dictates when to get out by providing evidence that the price is turning. If entering at a supply area, consider exiting at demand. If entering near a demand area, consider exiting near supply.

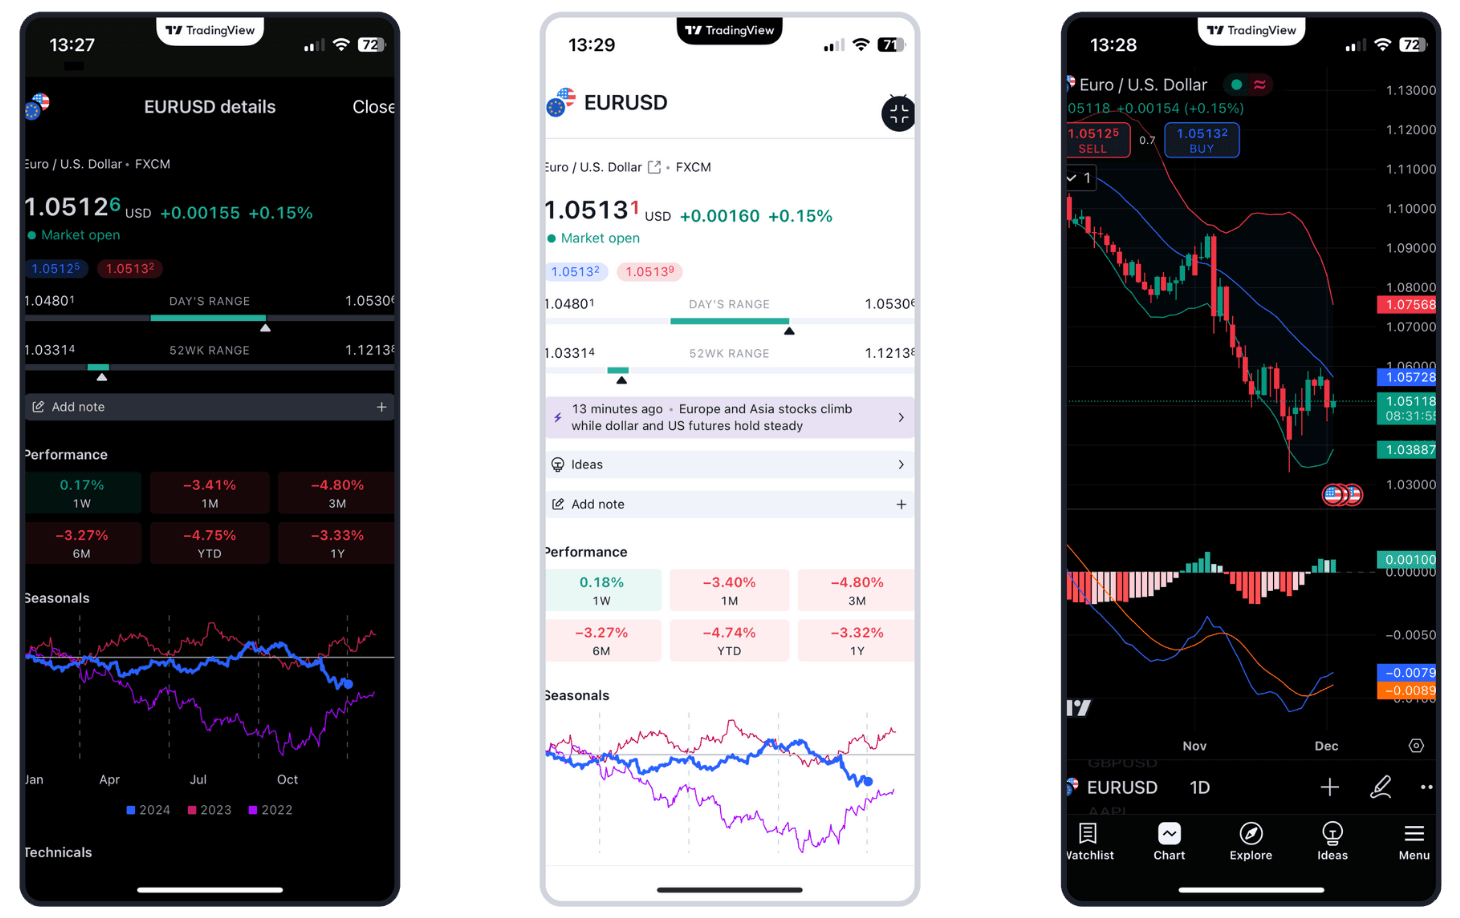
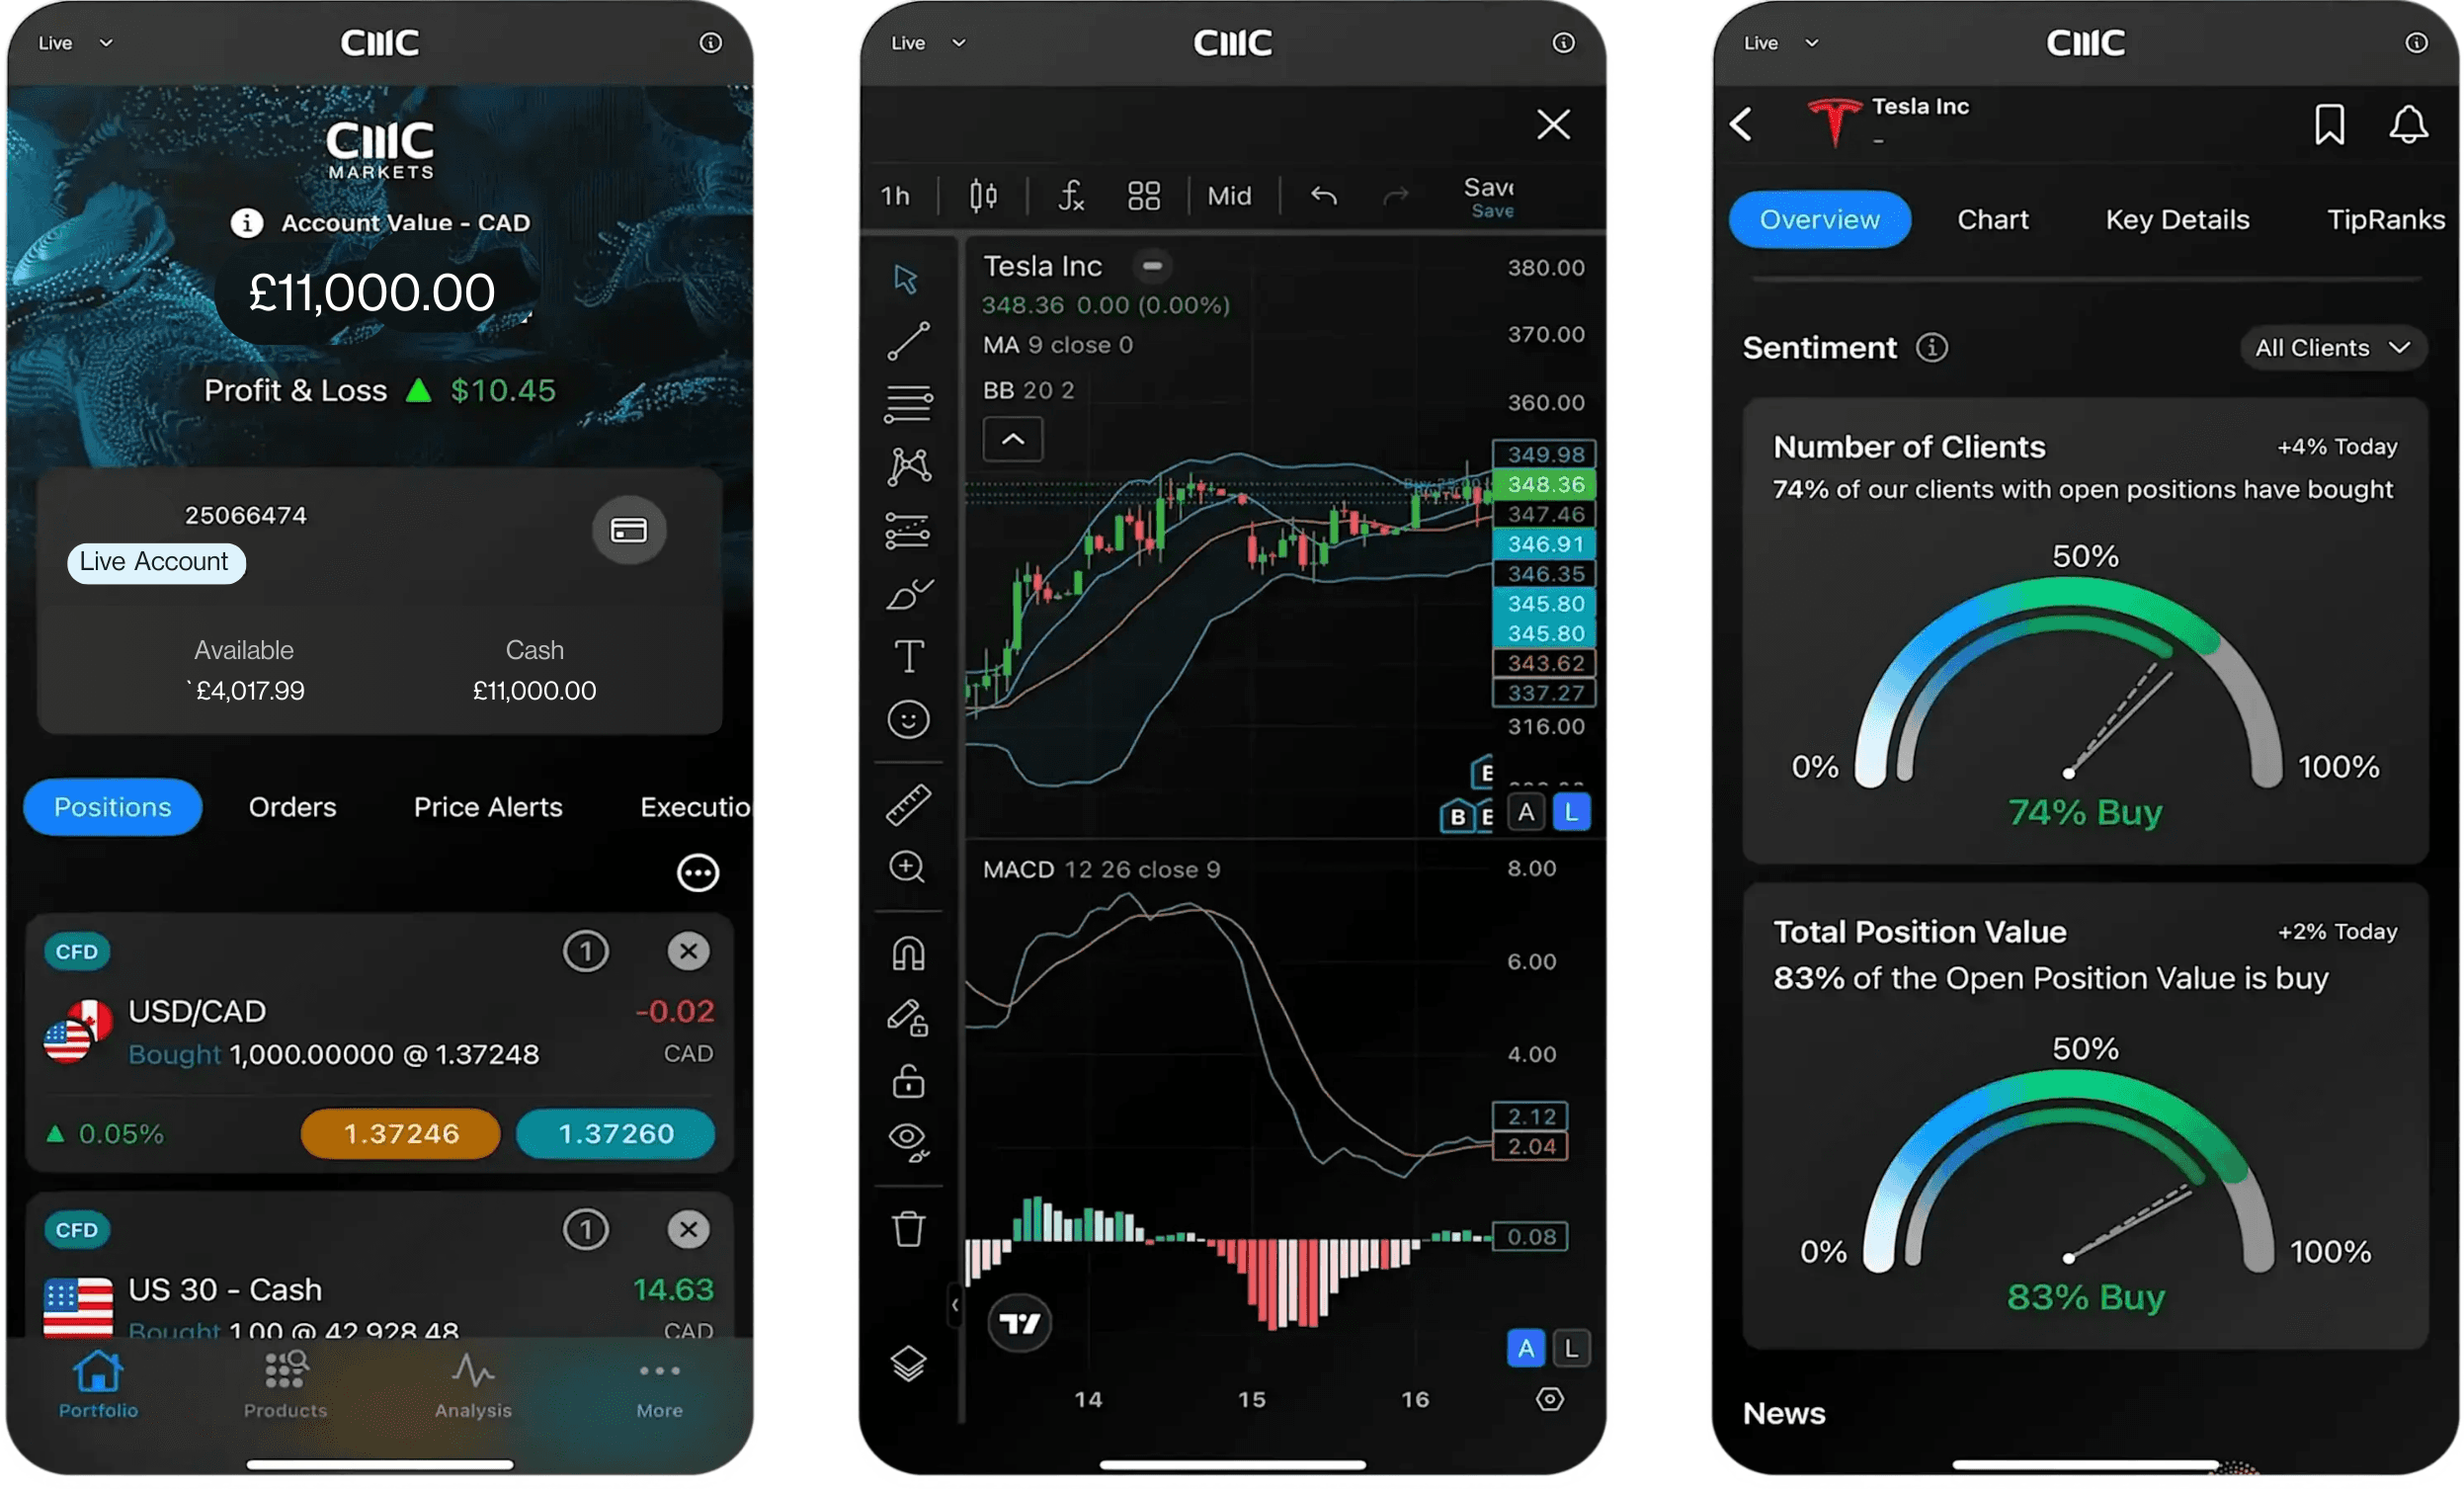
Practise price action trading on the go

Seamlessly open and close trades, track your progress and set up alerts

The best indicators for price action trading

Most price action traders do not use indicators, but some may if it helps them better identify entry, stop loss, and target levels. These trading indicators​​ may also provide a sense check to confirm what a trader is seeing in the price action.

Fibonacci retracements for support and resistance

The Fibonacci retracement is drawn on a chart from a low to a high (in an uptrend), or a high to low (in a downtrend). It indicates areas where the price could pull back to. The levels are 23.6%, 38.2%, 50%, 61.8% and 100%. In a strong trend, pullbacks are typically shallow, often only reaching the 38.2% level. In most trends, pullbacks exceeding the 50% and 61.8% levels are common.

The following chart shows a modest uptrend in crude oil. The last wave up is used to draw the retracement tool. The 100% goes at the bottom of the move and the 0% at the top because price is rising. You can reverse this method if price is falling.

Expect a pullback exceeding 50%. Then, wait for a trade signal as discussed prior. There is a strong move to the upside after the price drops below the 61.8% level. This is a potential buy signal. Read more about how to trade with Fibonacci retracements​​.

Relative strength index (RSI) for momentum

The relative strength index​​ (RSI) measures where the price lies in terms of its 14-period price range. When the RSI is above 70%, the price is in the upper realm of where it has traded in the last 14 periods. When it is below 30%, the price is in the lower realm of where it has traded in the last 14 periods.

Traders often wait for the price to move out of these areas during trends to help confirm trades. During an uptrend, traders will look to buy when the RSI moves below 30 and rallies above. During a downtrend, traders will look to short when the RSI moves above 70 and drops below. Other price action signals are typically used to confirm these signals.

Let’s look at the same crude oil chart as above, but this time an RSI is added. The RSI dropped below 30 and then rallied back above, at the same time that the price action and the Fibonacci retracement also signalled an entry.

Stochastic oscillator for identifying trend reversals

A stochastic can be used to help spot turning points and confirm price action signals. It is used in a similar way to the RSI. There are two lines on the stochastic indicator​: the stochastic and the signal line. The signal line is a moving average​ of the stochastic, so it moves more slowly.

A trader that is interested in trading a price action signal can watch for the stochastic to move through the signal line. If contemplating a long trade, they should wait for the price action signal and for the stochastic to move above the signal line. The stochastic provides similar information as the RSI on the crude oil chart.

Indicators may aid or help price action signals, but typically, the price action signal will come first. Awaiting confirmation from these lagging indicators may mean entering a trade later and missing out on profit, therefore, confirmation comes at a cost.

Price action trading system

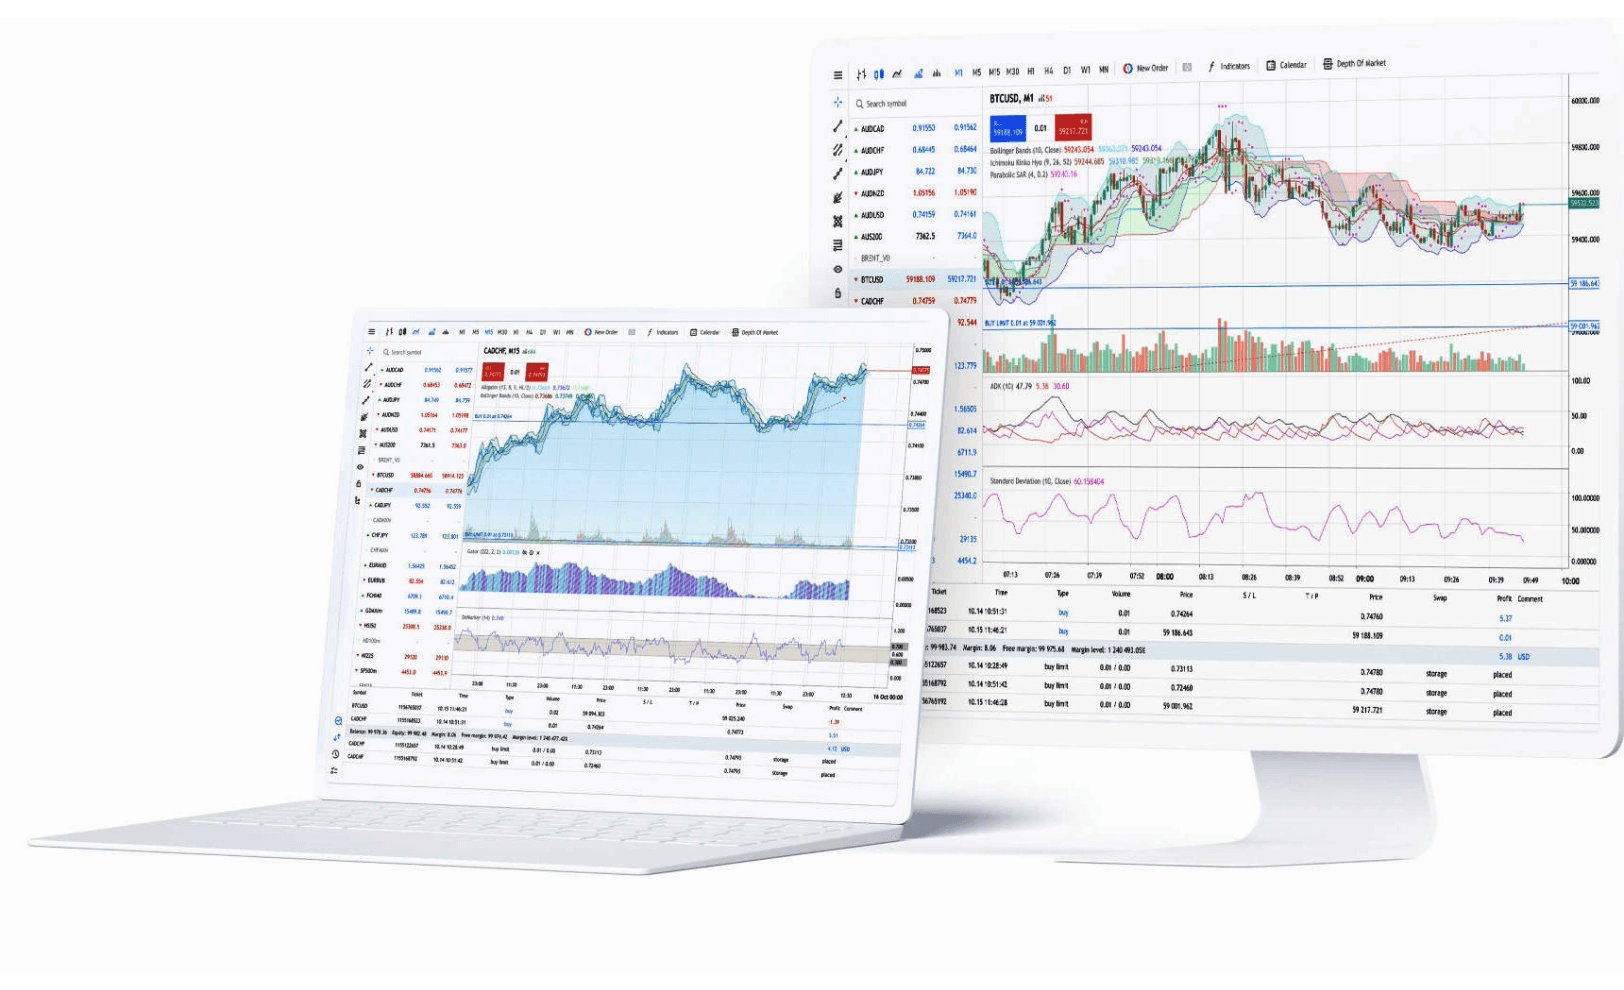
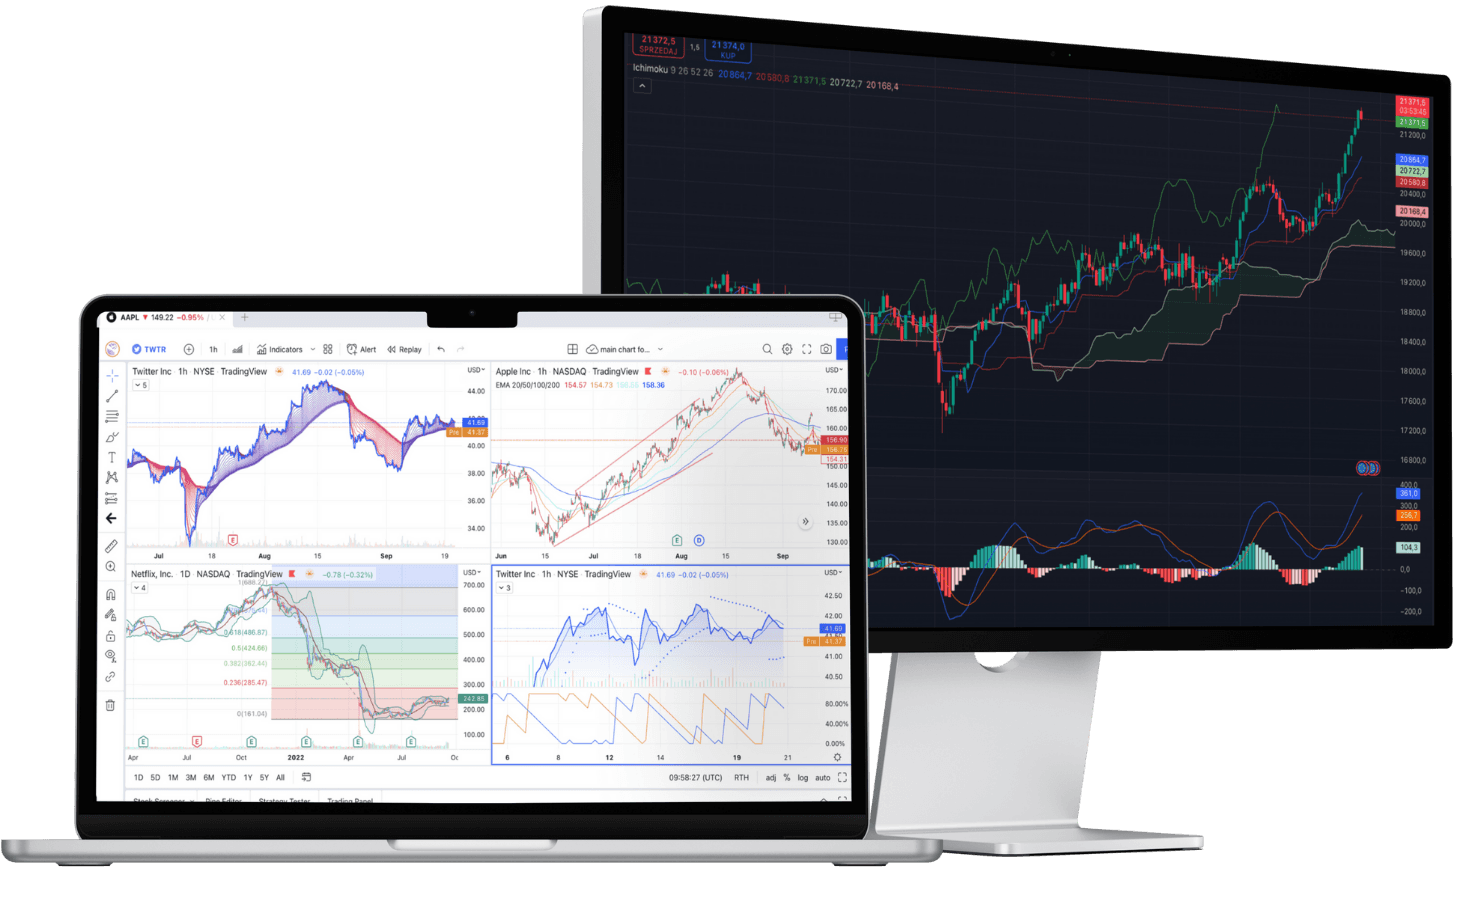
Price action can be studied through our online trading platform, Next Generation, where all of the above technical indicators are available. You can make use of our technical tools, including drawing and price projection tools, as well as our customisable charts.

You can practice these price analysis skills by registering for a demo account and trading with virtual funds, and when you are ready, you can switch to a live account to trade with real funds. It is advisable to focus on one strategy at a time and aim to learn it inside out. One solid strategy, traded well, has the potential to be highly profitable.

Is price action trading profitable?

Like any trading strategy or tool, profitability depends on how it is employed. Many successful investors and traders have all shown that trading price action trading can be profitable. However, traders that focus on price charts alone and do not take into account fundamental factors, such as economic indicators​​ and news announcements, may miss key events that have a major impact on the price of their security.

All profits and losses in trading are based on price. Price action traders focus on historical and current patterns to make money off where the price may head next. There have been many profitable price action traders, but it takes time to learn price action strategies, and spot trends, patterns, and reversals.

Hello, we noticed that you’re in the UK.

The content on this page is not intended for UK customers. Please visit our UK website.

Go to UK site