Spread bets and CFDs are complex instruments and come with a high risk of losing money rapidly due to leverage. 69% of retail investor accounts lose money when spread betting and/or trading CFDs with this provider. You should consider whether you understand how spread bets and CFDs work and whether you can afford to take the high risk of losing your money.

Treynor ratio

The Treynor ratio is a performance measurement that can be used by investors to determine whether the portfolio returns they are getting are worth the trading risk​. In this article, we discuss how to calculate the Treynor ratio using the Treynor formula, along with examples of how the Treynor index can be applied to various trading scenarios on our online trading platform.

Consider a simple example with two investments. Both investments returned 30% on the year. The two largest drops registered by Investment A were 50% and 30%, while Investment B’s largest drops were 13% and 9%. Investment B provides the same return for less risk, which is more desirable. The Treynor index helps to breaks this down into a single ratio so that investments and different types of portfolios can be compared to each other based on risk and reward​.

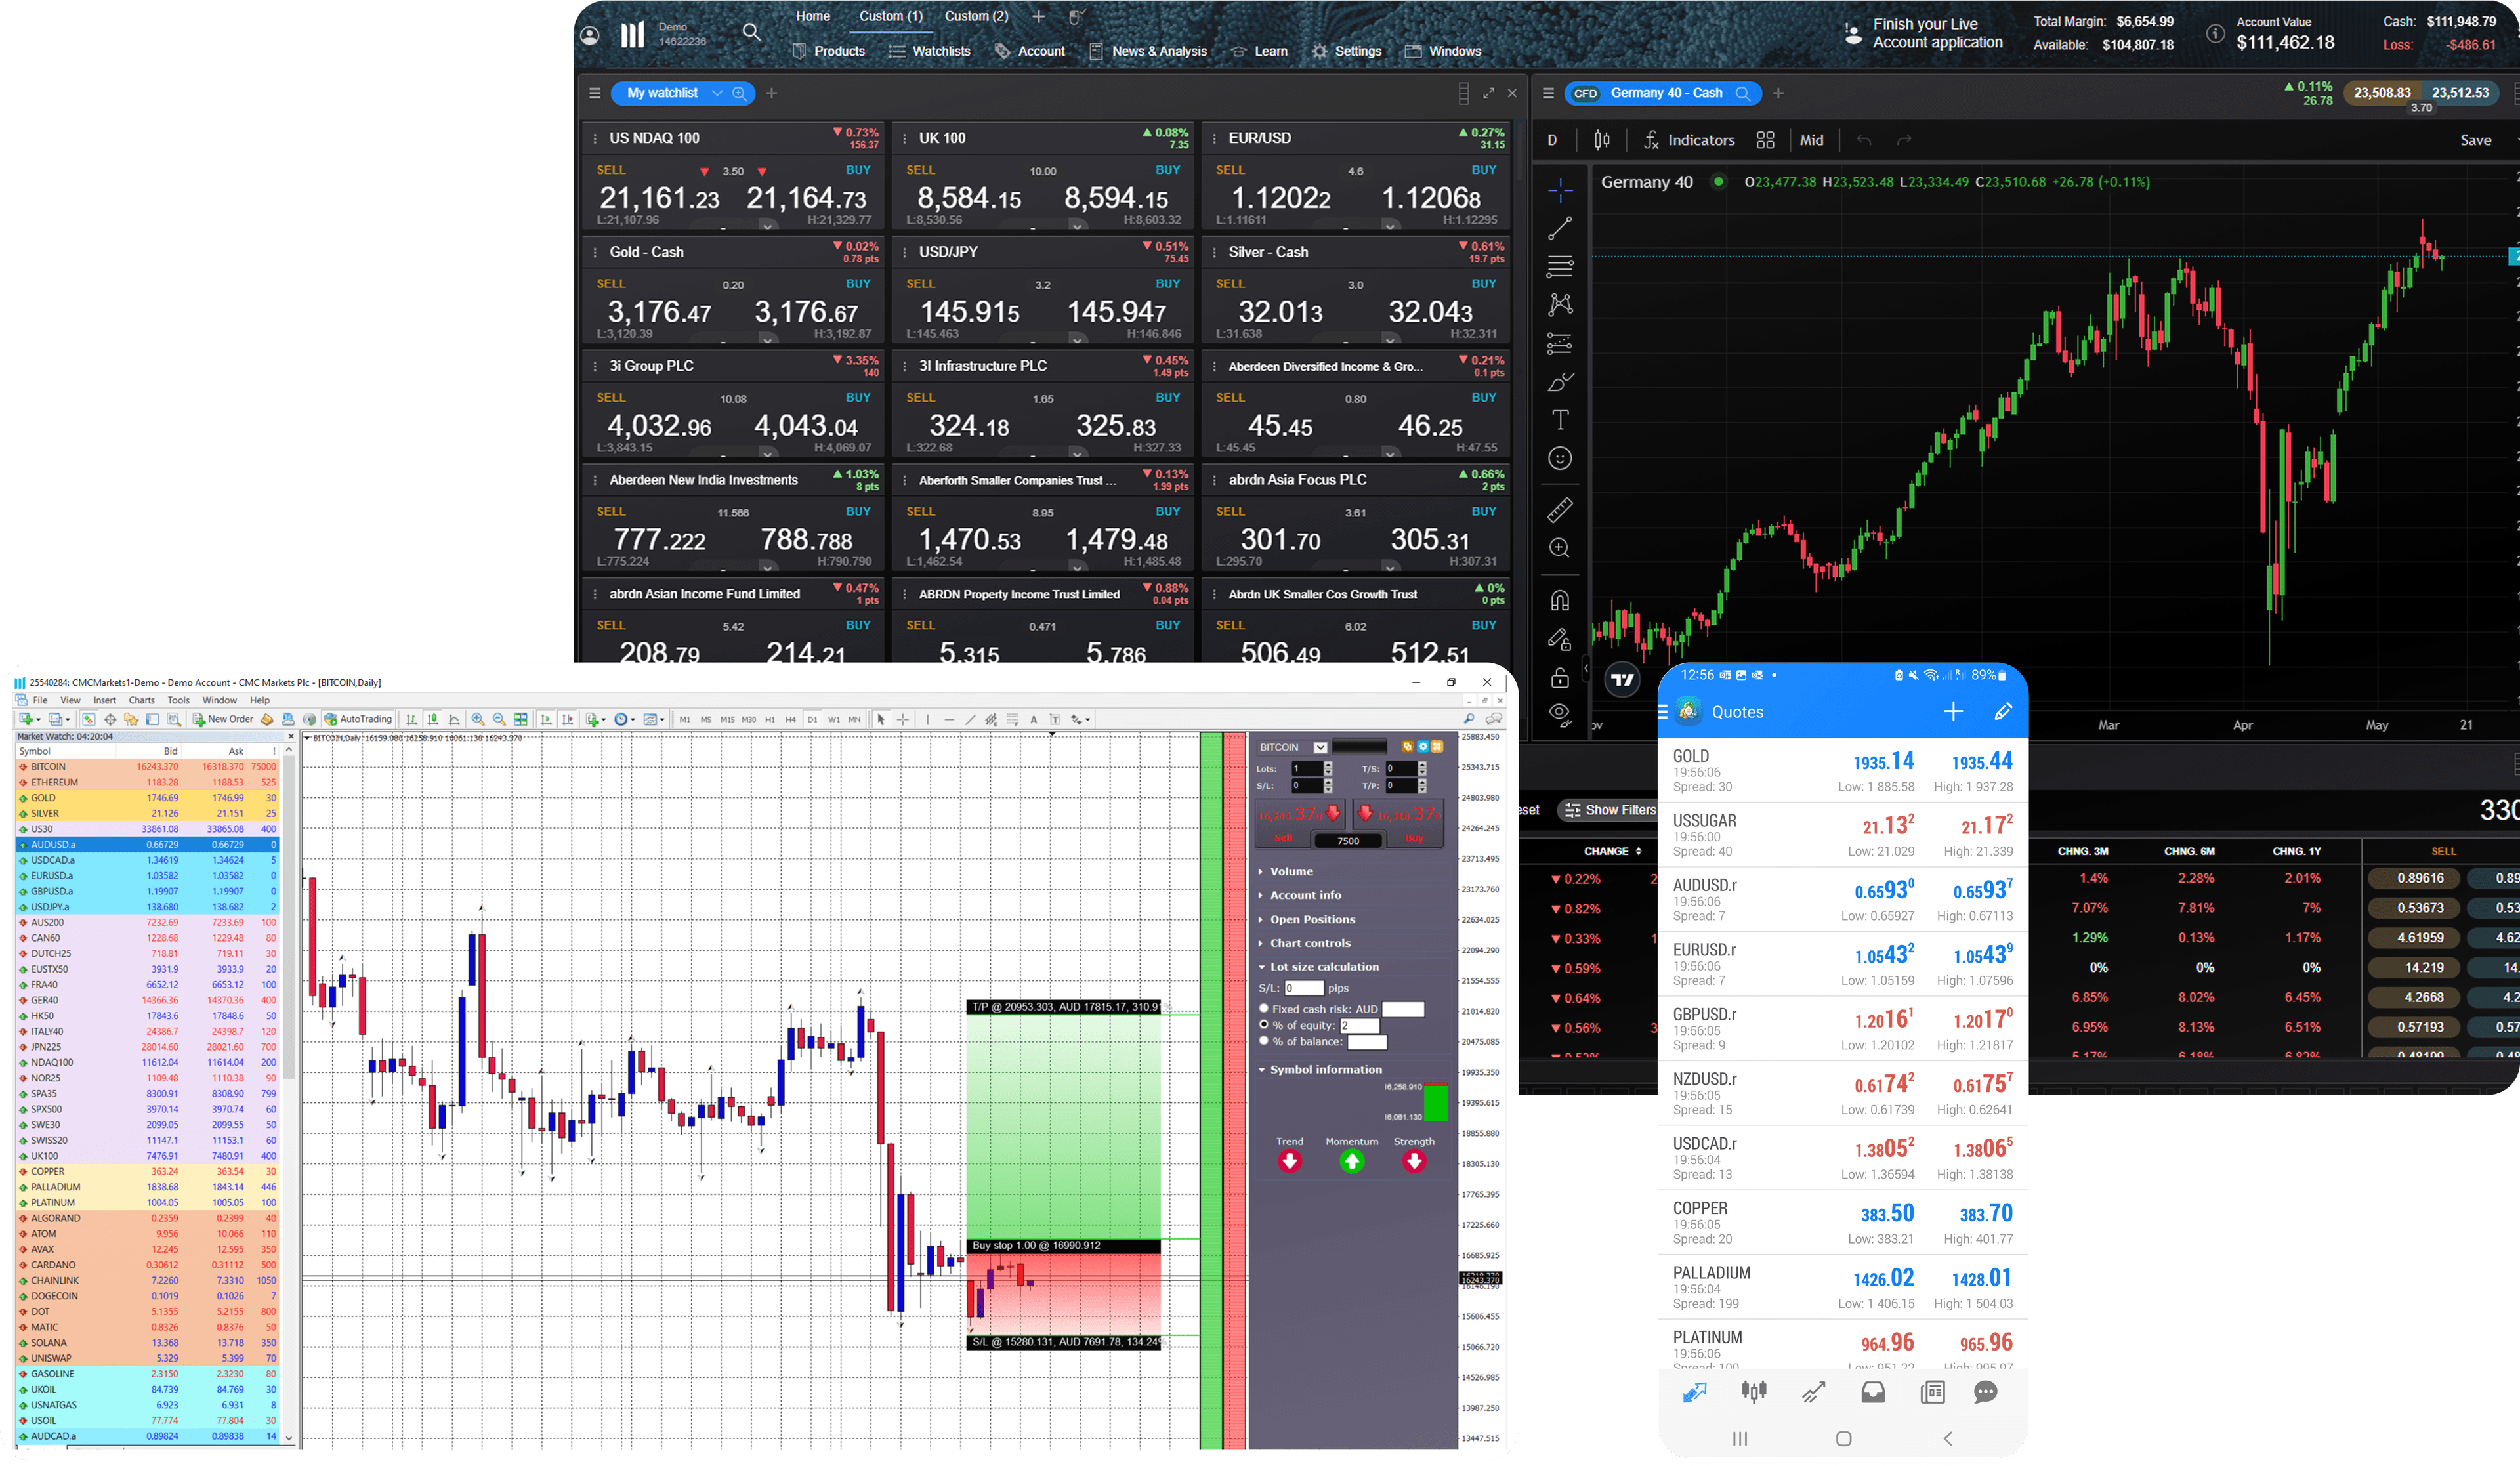
See inside our platform

Get tight spreads, no hidden fees and access to 12,000 instruments.

What is the Treynor index?

The Treynor ratio, also referred to as the Treynor index, measures the excess return for each unit of risk in a portfolio or investment. This is also called the risk-adjusted return.

Excess return is the return made over and above the risk-free rate of return. The risk-free rate is often considered to be the rate offered on US Treasury Bills, or, you could also think of it as the amount you get in a savings account. In both cases, there is very little chance that your money will be lost. If an investment yields 9% in a year, and the risk-free rate for one year is 1%, the excess return is 8%.

The Treynor ratio also factors in risk using beta, which is part of fundamental analysis​​. Beta measures how a stock moves relative to a major market index. The market index represents market risk, also known as systematic risk. This is the risk inherent in investing in a certain product, such as stocks.

Beta and systematic risk

Systematic or market risk is gauged by stock indices​​ as they are a large basket of stocks, which are not easily affected by price movements of the individual stocks within them. These terms all relate to the capital asset pricing model (CAPM), which is a larger topic that seeks to assess returns versus risk, similar to the Treynor ratio.

A stock beta​ of one means that the stock has similar volatility or risk when compared to the stock index. A reading of two means that it moves twice as much as the index. A reading of 0.5 means that volatility is half as much as the index. A negative beta means that the stock is moving in the opposite direction as the index. The Treynor ratio is not as useful when the beta of a stock is negative.

Treynor formula

Here is the formula for calculating the Treynor index:

Where:

rp is the risk of the portfolio

rf is the risk-free rate

βp is the beta of the portfolio

How to calculate the Treynor ratio

Calculating the Treynor ratio for an individual stock requires gathering information for the yearly return and beta for the stock, along with the risk-free rate. For example, let’s assume that a stock has averaged 15% gains over the past several years. The risk-free rate is 1%, while the beta of the stock is 1.3.

Treynor ratio = (15 – 1) / 1.3 = 10.77

Now assume that the beta is 2.7.

Treynor ratio = (15 – 1) / 2.7 = 5.19

While the two stocks returned the same amount, the Treynor ratio indicates that the one with the 1.3 beta is a better option because it has less risk. Beta is a measure of risk because it determines how much the stock moves relative to an index.

When multiple assets are involved, the calculation requires the portfolio return and the risk-free rate, plus the average beta of the portfolio. To calculate the average, take the weighting of the stock in the account, multiply by the return, then add up all the returns. Do the same for the beta, multiplying it by the weight in the portfolio, and then adding up those numbers.

Let’s calculate the measurements for a simple two-stock portfolio. 60% of the portfolio is invested in Stock A. It returned 10%. The beta is 1.7. 40% is invested in Stock B. It returned 17%. The beta is 2.1.

Return for the portfolio = (0.6 x 10) + (0.4 x 17) = 12.8%

Beta for the portfolio = (0.6 x 1.7) + (0.4 x 2.1) = 1.86

The risk-free rate is 1%.

Treynor ratio = (12.8% – 1%) / 1.86 = 6.34

Learn more about how to perform company analysis​ in order to assess whether an investment will provide worthy returns in the long-term.

Join a trading community committed to your success

What is a good Treynor ratio?

A higher Treynor ratio is typically seen as better than a lower one, because the investor is receiving a higher return relative to the risk (beta) being taken. However, the Treynor ratio is used to compare investments and does not explicitly say whether an investment is good or bad. Some traders are willing to trade riskier assets in the hopes of catching a big price movement and profit, whereas others are not.

There is no set level at which an investment becomes good or bad. Furthermore, the Treynor ratio is based on historical data. A lower Treynor ratio one year could become very good the next if volatility dies down or returns increase, or a high ratio could become worse. The Treynor ratio is not necessarily predictive as it only looks backwards, therefore, most traders do not use the tool in isolation.

Negative Treynor ratio

The Treynor index is not typically used with negative numbers because it becomes harder to interpret. It is more often used with positive returns and betas. There are two ways in which a Treynor ratio can be negative: there is a negative return or there is a negative beta.

In either case, we cannot simply say if one ratio is better than another. Logic would say that since we want to get the ratio positive and moving higher, a smaller negative number is better. This may not always point to the best investment though, because, if the returns of two stocks are equally negative (-15%), the one with a higher beta will have the less negative Treynor ratio. The investor will need to decide if they want to trade on a more volatile stock with a less negative Treynor, or a less volatile stock with a more negative Treynor. Learn more about trading on volatility​​.

Treynor ratio example

As an example, let’s look at how to calculate the Treynor ratio for a share basket​, such as the ones offered on our Next Generation trading platform. A share basket tracks the movement of many stocks, often belonging to the same sector or industry group. The Big Tech share basket​ tracks the shares of large technology companies, such as Google, Apple and Microsoft.

This share basket has a beta of 1.06.

At the time of writing, the one-year US treasury bills rate is 0.13%, which is the risk-free rate.

The chart shows that, over the past year, the share basket returned 39.62%. The S&P 500 Index is also shown for comparison. The S&P 500 has a beta of one, since it is a benchmark index often used for calculating beta.

Big Tech Treynor ratio = (39.62 - 0.13) / 1.06 = 37.25

We can also see that the S&P is up 16.06% over the past year.

S&P Treynor ratio = (16.06 – 0.13) / 1 = 15.93

The Treynor ratio indicates that the Big Tech share basket provided more return for each risk unit than the S&P 500 over this timeframe. Whether this performance will continue in the future is unknown, but traders can use this metric to make current trading decisions.

Sharpe vs Treynor ratio

The Treynor ratio and Sharpe ratio​​ are similar. The only difference lies in the denominator of the formulas. The Treynor ratio uses beta to assess risk, whereas the Sharpe ratio uses standard deviation of returns.

Standard deviation​​ is how far returns are dispersed around the mean or average. A stock that has an average yearly return of 10% but swings wildly will have a higher standard deviation than a stock that edges higher and more slowly on most weeks.

Beta and standard deviation both have drawbacks. Beta compares an asset to an index to establish volatility, although this is not always the most useful comparison. Some assets do not have a relative index for comparison. Standard deviation only works well when data is normal and evenly distributed, although stock returns can be erratic. However, this does not necessarily mean that they are bad investments. Once again, both these ratios are tools and are not meant to be used on their own when making trading decisions.

Powerful trading on the go

Seamlessly open and close trades, track your progress and set up alerts

How to use the Treynor ratio in trading

Traders may wish to consider using the Treynor index as an additional tool when making investment decisions. For short-term trades, Treynor is not particularly useful since it is based on longer-term values which may not apply to trades lasting just a couple of weeks or less.

If you are considering two investments, you could calculate the Treynor ratio on each to help to assess which one provides better returns for the risk (usually a higher figure). When the Treynor value is negative, the ratio is not as useful.

The main pitfalls of the Treynor ratio include the fact that it is only backward looking and historical returns and betas may not accurately reflect the future. Stocks have pre-calculated betas but, for other markets, they will likely need to be manually calculated. To calculate the beta, an index must be selected to compare the asset to. For example, you could analyse a commodity index​​ to get the beta of a commodity. This can complicate computing the Treynor ratio when there are multiple assets within a portfolio. These drawbacks should all be taken into consideration, along with its advantages, when deciding to trade using the Treynor ratio.

Join over 275,000 other committed traders

1

Apply for a live account

Complete our straightforward application form and verify your account

2

Fund your account

Deposit easily via debit card, bank transfer or PayPal

3

Find and trade

One touch, instant trading available on 12,000 instruments

Hello, we noticed that you’re in the UK.

The content on this page is not intended for UK customers. Please visit our UK website.

Go to UK site