Financial asset prices often fluctuate between periods of stability and sudden, extreme movements. Investors may become impatient waiting for trend changes, only for prices to change dramatically in the blink of an eye, catching some investors off guard while others benefit. Once prices shift dramatically, explanations and narratives follow.
Here are some examples of recent price explosions, with potential narratives and explanations:
US Small Cap 2000
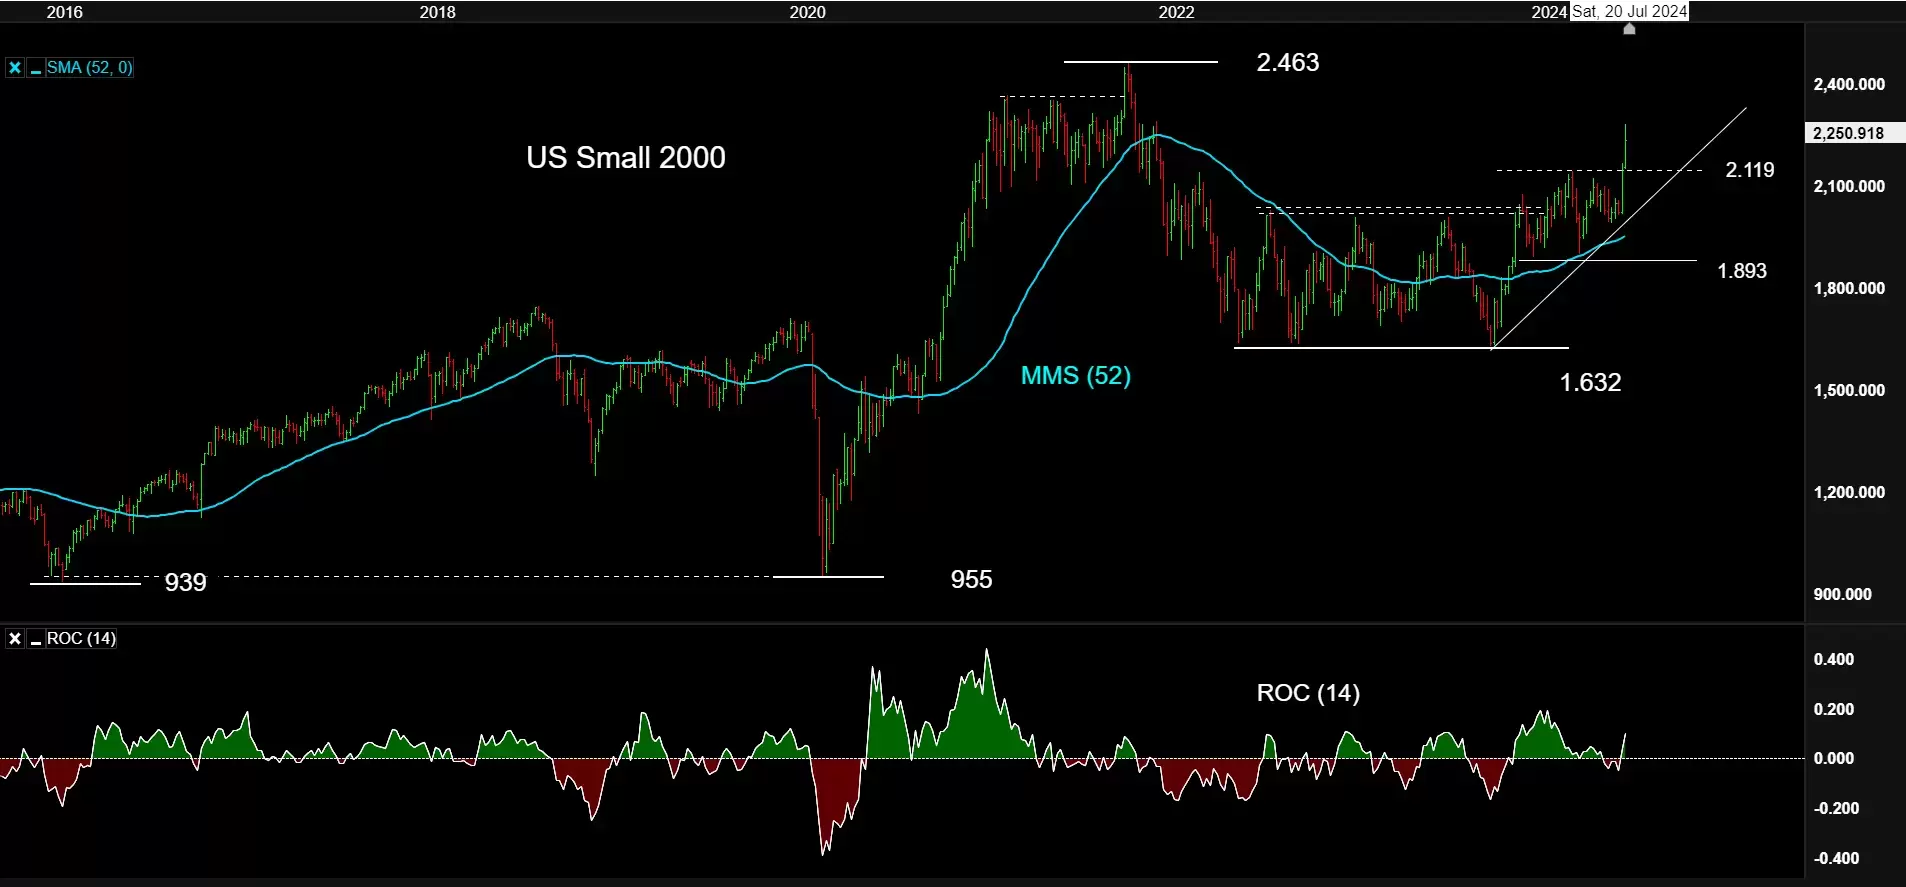
In two weeks, the US Small Cap 2000 index surged over 10%, breaking out of a six-month sideways trend.
This could be due to anticipated interest rate cuts driving investment back into previously penalised companies and sectors, spurred by stronger-than-expected US CPI inflation data.
USD/JPY
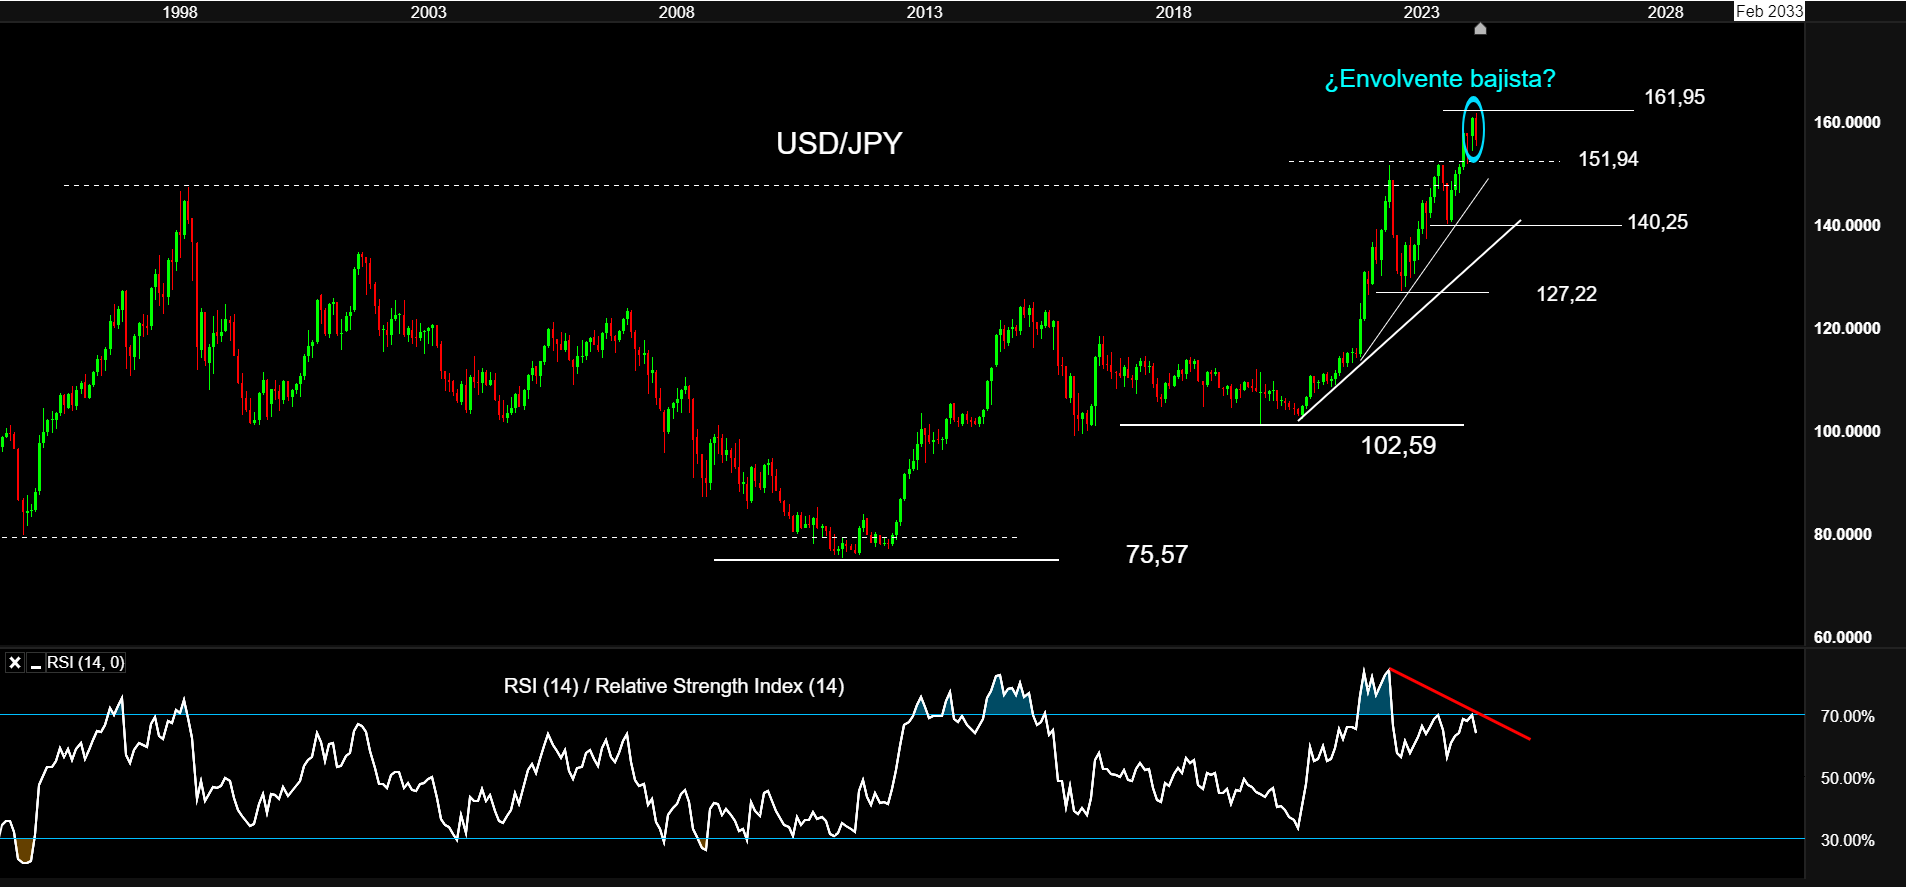
USD/JPY is falling sharply, with a potential bearish engulfing pattern on the monthly chart suggesting a potential trend change.
This potentially results from Japanese authorities intervening to defend the yen, coinciding with depreciation in the US dollar due to the possibility of interest rate cuts from the Federal Reserve.
ASML and TSMC
ASML and Taiwan Semiconductor Manufacturing Company (TSMC) are both moving away from historic highs, showing possible trend reversal formations on monthly charts. ASML is forming a bearish engulfing pattern, while TSMC is forming a shooting star pattern.
Despite positive second-quarter results from both companies; high valuations, rotation to undervalued companies, and escalating geopolitical tensions affecting the chip business could be driving their recent declines.

Bitcoin and ethereum
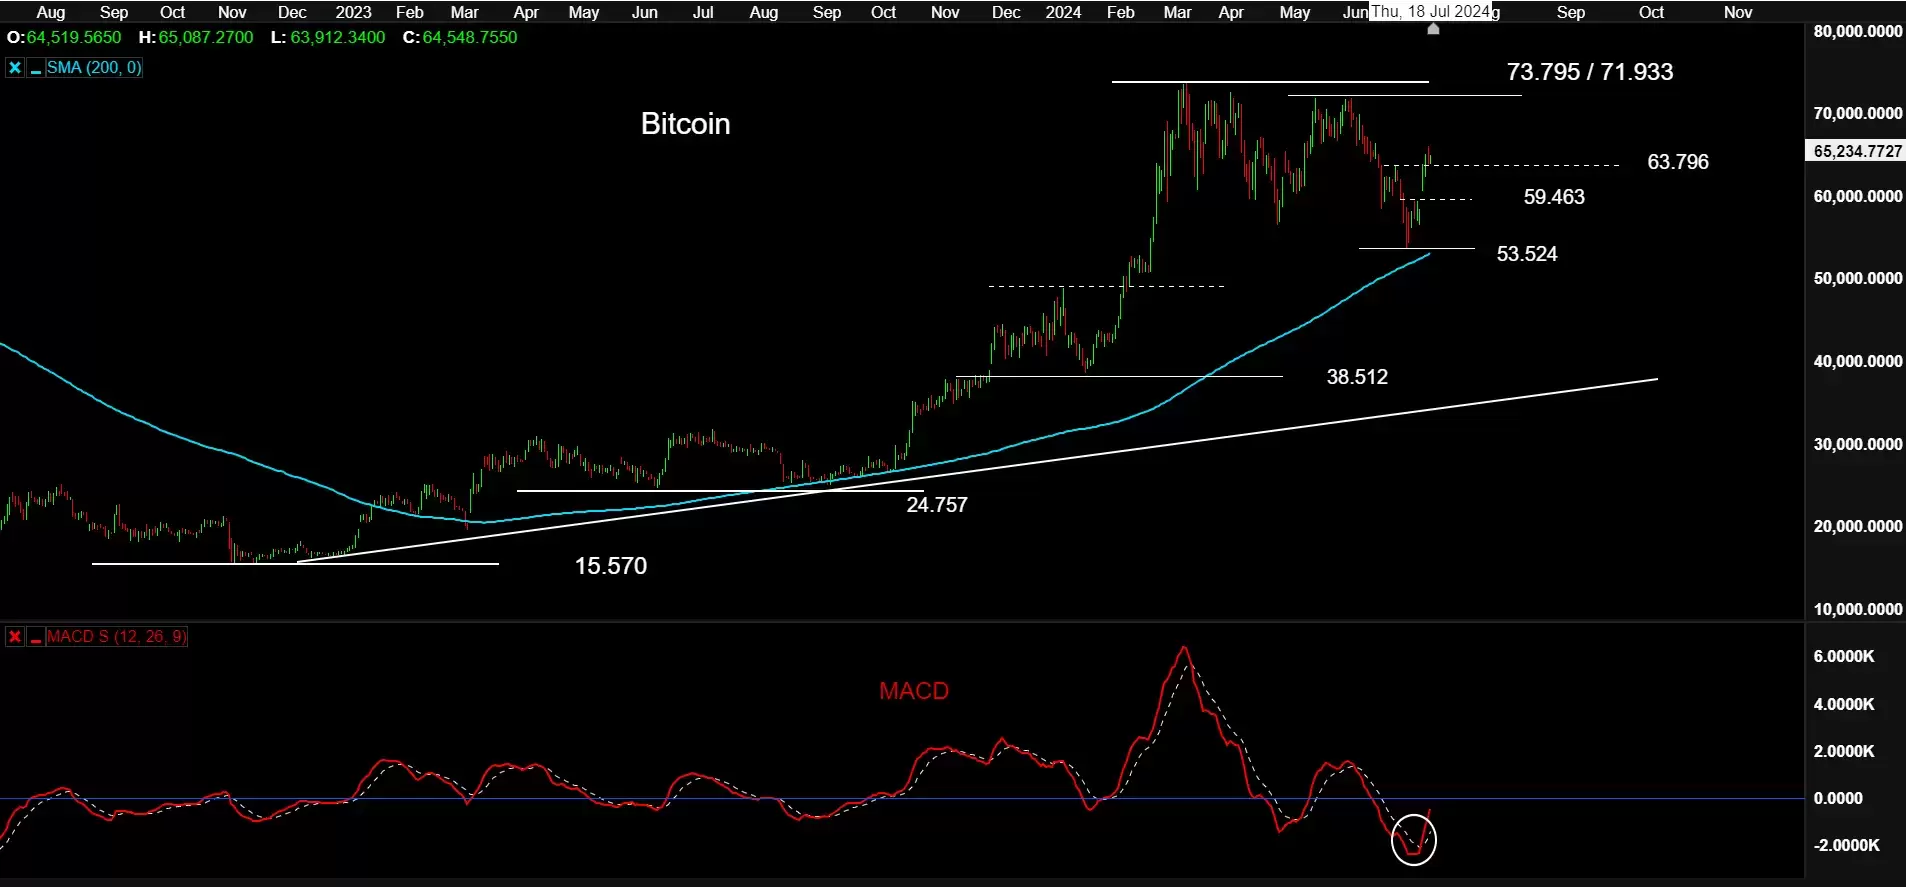
Cryptocurrency majors bitcoin and ethereum have rebounded over 20% in two weeks after testing the 200-day simple moving average.
This rally may be driven by institutional acceptance ahead of upcoming ethereum spot ETF listings, as well as the potential return of former US president, Donald Trump, who is widening his lead over President Biden in US election polls, ahead of November's US election.
Disclaimer: CMC Markets is an execution-only service provider. The material (whether or not it states any opinions) is for general information purposes only, and does not take into account your personal circumstances or objectives. Nothing in this material is (or should be considered to be) financial, investment or other advice on which reliance should be placed. No opinion given in the material constitutes a recommendation by CMC Markets or the author that any particular investment, security, transaction or investment strategy is suitable for any specific person. The material has not been prepared in accordance with legal requirements designed to promote the independence of investment research. Although we are not specifically prevented from dealing before providing this material, we do not seek to take advantage of the material prior to its dissemination.


