Trading charts
Trading charts are an important aspect of technical analysis that allow traders to study the price action of various financial assets. This helps to analyse price movements, identify entry and exit points in a trade, and decide where to place stop-loss and take-profit orders.
In this article, we will discuss the most popular chart types on our web trading platform, Next Generation, along with examples of overlays, technical studies and drawing tools that you can apply to price charts. This may help you to find the trading chart for your trading personality and style, in order to make more informed investment decisions. We have put together a video below on the different chart types that exist on our platform for an in-depth exploration.
Introduction to Charting
Our award-winning trading platform* comes with a wide range of trading chart types, including the following:
Candlestick charts
Line graphs
Bar charts
Renko charts
Among these are also more niche trading charts that are preferred by more experienced traders, such as Point & Figure, spread, Heikin-Ashi, Line Break and scatter graphs.
Get access to live trading charts
Register for a live account here to access our various trading chart types, which are also available when you practise trading the markets with £10,000 worth of virtual funds on a demo account.
How to read trading charts
Our platform comes with advanced charts with up to 20-years’ worth of price history on selected instruments. It is a simple process to open an order ticket using our trading charts: you simply choose to ‘buy’ or ‘sell’ an asset at its current market price, and then edit stop-loss order settings and take profit levels directly on the charts
.Our trading charts come with both short and long timeframes to filter between recent and historic price action. For example, you are interested in using a short-term strategy for scalping forex, you could select any interval between 1 second and 5 minutes, to take advantage of quick and rapid price fluctuations. On the other hand, if you are holding a long-term position for a growth stock, then you could view price data from 6 months to 5 years ago. Learn how to choose the right chart timeframe for your trade.
The purpose of analysing trading charts is to figure out the trend direction (either uptrends or downtrends), momentum and volatility of an asset. When there is data plotted in a specific direction, traders can identify an overall direction that the asset’s price is moving towards. However, some trends can be difficult to spot, which is why traders often use multiple chart types to carry out closer analysis.
The type of trading chart that you choose depends on your level of experience and the complexity of the trade. For example, a bar or line graph may be more suitable for beginner traders, whereas candlestick and Renko charts could be more suitable for those with more knowledge of the markets.
Please note that the below charts are displayed in the same way for both spread betting and CFD trading.
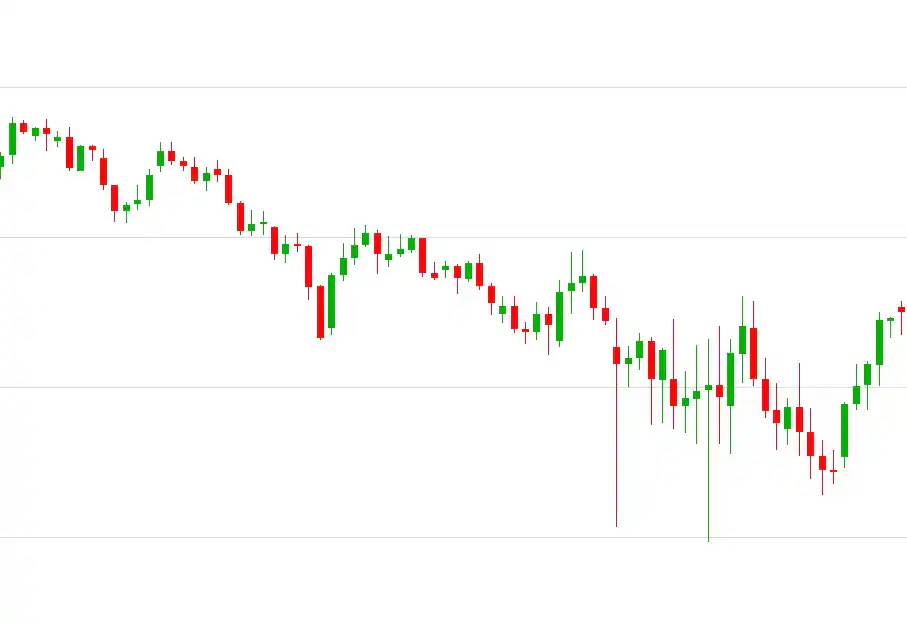
Candlestick charts
Candlestick charts are the most common type of trading chart on our platform. These are slightly more complex than a simple line or bar chart. Each candle represents a specific time period; for example, five minutes, one hour or one day. Each candle also shows you the high, low, open and close prices for the selected timeframe. The thick coloured body of the candle shows the opening and closing prices and the thin wicks represent the highest and lowest prices. If the price is trading higher than the previous close, then the body of the candle will be coloured green; if it is lower, the candle will be red. These candlesticks can represent either a bearish or bullish trend, depending on the direction and colour. Learn more about candlestick trading.
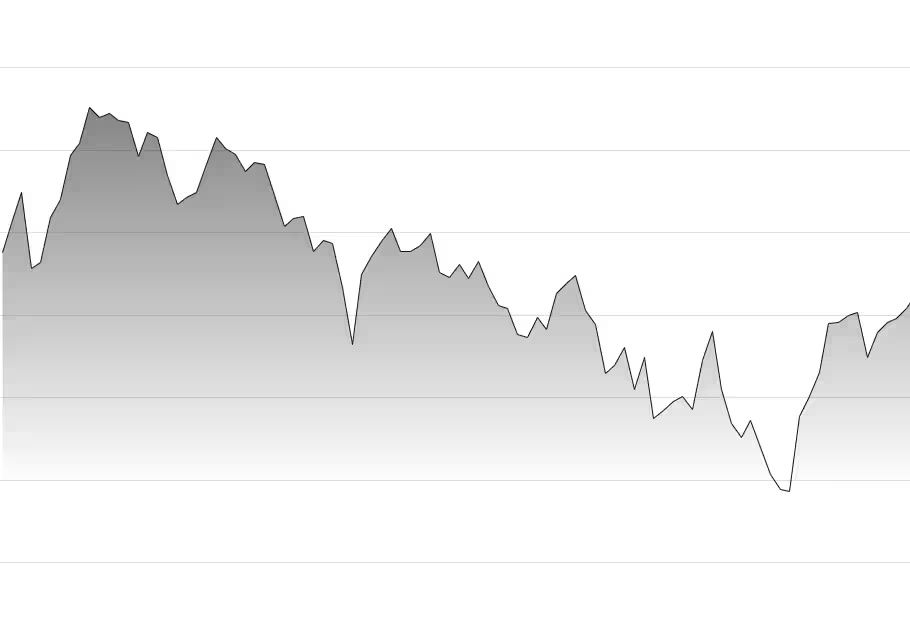
Line chart trading
Line charts are perhaps the simplest type of charts in the financial markets. There is no high or low point specified, unlike bar and candlestick charts. Instead, they are based on lines drawn directly between the closing prices. This chart type is commonly used in reports and presentations to show general price fluctuations; however, they often lack granular information. When compared to other trading chart types, they are not as precise in identifying trading patterns or entry or exit points.
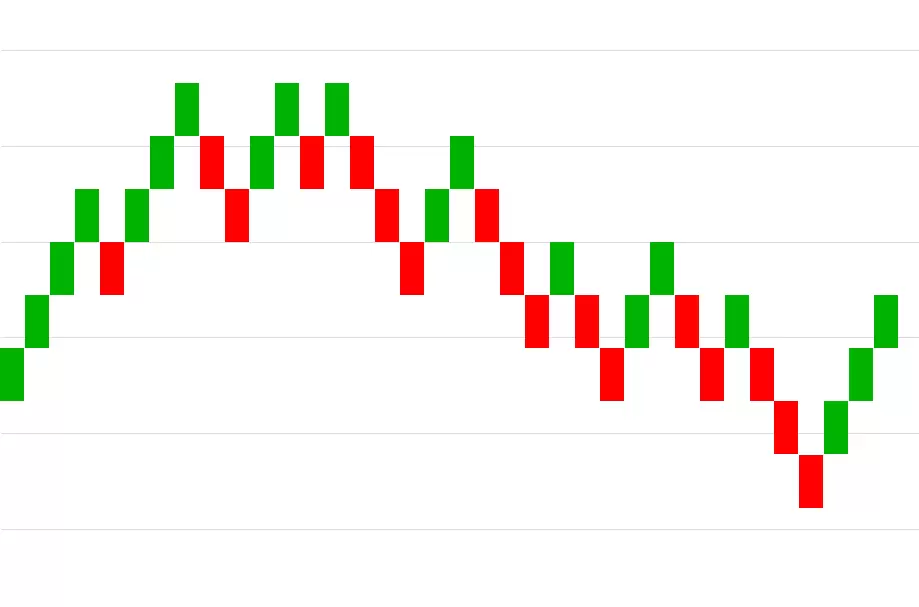
Renko charts
Renko charts are a popular choice for financial markets that have a clear trend direction. Renko charts form bricks to represent strong uptrends or downtrends, ignoring smaller price fluctuations in order to represent the overall direction. Each new brick appears once the price has moved a particular amount, and they stay the same colour until a new reversal occurs. When trading with Renko charts, traders may wish to ride the trend as long as the colour stays the same. If it starts to reverse, traders could then consider exiting their positions, as it may signal a price reversal.
Trading bar charts
Bar charts are very similar to candlestick charts in appearance, and also show opening and closing prices, as well as the highs and lows for a specific period. As opposed to a line graph, the data is more in-depth and uses a single vertical bar. The top of the bar represents the highest price achieved for the specific timeframe and the bottom of the bar represents the lowest price. Additionally, a horizontal bar extends to the left of the bar, which denotes the opening price, and a short horizontal bar extends to the right of the bar, which signifies the closing price. The direction of a trade can be seen in a similar way to candlestick charts from the colour of the bar. A green bar indicates that the closing price was higher than the open and a red bar indicates that the opening price was higher than the close, indicating both bullish and bearish trends.
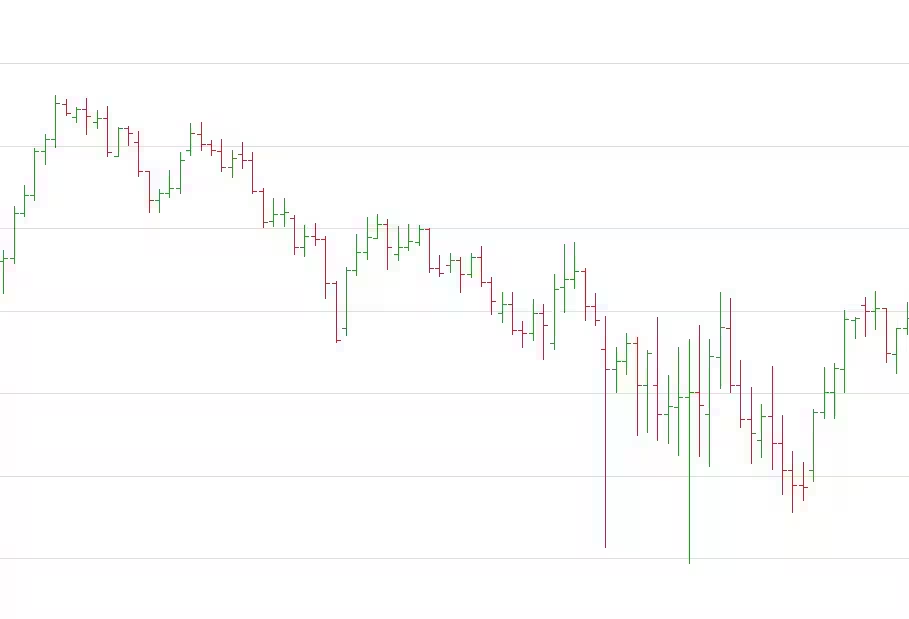
Chart trading platform
When trading from price charts, it is vital that you understand how price action works. This is why we offer such a variety of chart types and layouts, so that your data is displayed in the most simple and coherent form as possible.As shown in the video below, we also have a number of platform tools, such as our module linking tool, chart pattern screener and client sentiment tool, which are particularly helpful for building technical analysis skills and knowing what other traders are currently focusing on. It is possible to use our drawing tools to highlight trendlines, chart patterns and support and resistance levels for each asset that you are trading. Read more about our charting features here.
How to link trading charts
You can combine all of the above tools using module linking when trading on our platform. The majority of modules within the Next Generation trading platform can be linked together so that navigating the platform is easier and more efficient. When two or more modules link together on a trading chart, the products will automatically change to reflect one another. This linking option will appear in the top right of the module if it is available. Simply click one of the four boxes, which represent four different colours, to include that module within a group.Learn about our module linking feature below, as well as other useful tools that can be applied to your trading charts for optimal trading success.
When module linking is attached to trading charts, there are a few rules to be aware of:
If you link an existing chart to a group containing another chart, the product in the added chart will be updated to match the group's product. There can only be one product displayed per linked group.
All technicals, drawing tools and settings from the current group will be applied to the newly linked chart.
The interval of the new linked chart stays the same, so you can view multiple chart time frames quickly and easily.
Almost all of the functions applied or changed on one chart within the group will automatically appear within the other linked charts, including drawing tools, technicals, chart type, patterns, pre-sets, dynamic lines and advanced settings.
Previous functions will be cleared, apart from a few exceptions including time interval, timeframe, reset view and trade plots.
Trade directly from charts with CMC Markets
By registering for an account with us, you can set-up live trading charts and gain access to all of our platform features that are exclusive to account holders. This includes daily Reuters and Morningstar updates, as well as chart forums and module linking opportunities.
Whether you want to start trading now or practise your strategies first on our trading charts, there is an account to suit you. You can also browse our instruments page for live market data for financial assets including stocks, forex and commodities.
The most suitable chart for you will depend on your strategy, timeframe, and visual preference. Popular trading charts include candlestick charts, line graphs, bar charts, and Renko charts.
Once you’ve created an account with us, and then logged in to our trading platform, you can open a chart from your chosen instrument, where you can apply a range of technical analysis tools. You can also place a buy or sell order directly from the chart using our multi-functional tickets, and apply risk-management controls.
Traders adopting a short-term strategy, such as scalping or day trading, might choose from a range of shorter timeframes, from 1-second, through to 1-hour. If you’re using a longer-term strategy, such as swing trading or position trading, a daily, weekly, or monthly timeframe may be more suitable. Learn more about trading on different chart timeframes.


Ready to get started?
Disclaimer: CMC Markets is an execution-only service provider. The material (whether or not it states any opinions) is for general information purposes only, and does not take into account your personal circumstances or objectives. Nothing in this material is (or should be considered to be) financial, investment or other advice on which reliance should be placed. No opinion given in the material constitutes a recommendation by CMC Markets or the author that any particular investment, security, transaction or investment strategy is suitable for any specific person. The material has not been prepared in accordance with legal requirements designed to promote the independence of investment research. Although we are not specifically prevented from dealing before providing this material, we do not seek to take advantage of the material prior to its dissemination.
*No1 Web-Based Platform, ForexBrokers.com Awards 2020; Best Telephone & Best Email Customer Service, based on highest user satisfaction among spread betters, CFD & FX traders, Investment Trends 2020 UK Leverage Trading Report; Best Platform Features & Best Mobile/Tablet App, Investment Trends 2019 UK Leverage Trading Report.