15th July 2021

Statistics in Decision Making
Statistics provides structure and tools to deal with uncertainty, enabling smarter and faster evidence-based decision making. A recent study from Smarter with Gartner found that “By 2023, more than 33% of large organizations will have analysts practising decision intelligence, including decision”, which is only possible with statistics.
Data about data:
Too much information can cause issues for leaders aiming to make informed, evidence-based decisions. This highlights the importance of statistics in decision-making as the ever-growing mountain of data are transformed into usable information and actionable steps.
Understanding Differential Privacy: Resolving privacy issues
Differential privacy is a system for publicly sharing information about a dataset by describing the patterns of groups within the dataset while withholding information about individuals in the dataset.’
Differential privacy makes it possible for tech companies to collect and share aggregate information about user habits while maintaining the privacy of individual users.
Differential Privacy in Real Life:
Stats tips: The average of the average … is not the average – so don’t do it
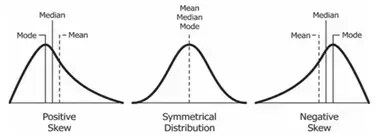
A measure of central tendency is a single value that attempts to describe a set of data by identifying the central position within that set of data.
The mean, median and mode are all measures of central tendency and their relative distance from each other determines the distribution shape

An average of averages is wrong in that it doesn’t consider how many units went into each average. Instead, calculate the overall group average Alternatively, different measures of central tendency can be used e.g. the median or the mode
Pitfalls of Over-Interpretation: Do not succumb to the temptation to over-interpret the results of statistical studies. Common mistakes include:
Extrapolation to a larger population than the one studied e.g. Running a brand survey for traders younger than 35 and then drawing a conclusion about all traders in general.
Extrapolation beyond the range of data e.g. Average fund amounts are gathered over Feb20 to Mar20 at the height of the COVID volatile period and these are used as ‘typical’ fund amounts expected for FY22.
Using overly strong language in stating results – statistical procedures do not prove results; they only give us information on whether the data support or are consistent with conclusions. There is always uncertainly involved. Thus, results need to be phrased in ways that acknowledge this uncertainly.
Considering statistical significance but not practical significance e.g. suppose a well-designed, well carried out, and carefully analysed study shows that there is a statistically significant difference in life span between people engaging in certain exercise regime of least 5hrs a week for 2 years and those not following this exercise regime. If the difference in average life span between the two groups is 3 days … well, so what?