You’d be forgiven for thinking that not much has happened in the last three months, having seen equity markets get off to a strong start in the first six month, with record highs for the FTSE 100 in mid-February above 8,000, the DAX making new record highs in June, and for the CAC 40 in April.
Since the end of June European markets have chopped about in a broad range, although the DAX did manage to eke out another record high towards the end of July above 16,500, however the move wasn’t matched by the FTSE 100 or CAC 40 which have continued to chop in a broad range. For most of this last 12 months and the lows from last October the main questions facing investors have been whether the resilience this year has been a bear market rally, or a move to new sustainable record highs.
Of course, all this speculation came against a backdrop of how many more rate hikes are coming, and how quickly would central banks start to cut rates again. At the start of the year this had markets pricing in rate cuts for the second part of this year. This notion now comes across as entirely fanciful, with the rate cut narrative now getting pushed well into the back end of 2024 at the earliest. This change in timing was given an added nudge when the Fed raised its outlook for the Fed Funds rate for 2024 from 4.6% to 5.1%.
For those of us who have been around for more than 20 years, rapid rate cuts were never a realistic proposition given where inflation currently is, and even more so now given what we’re seeing with respect to oil prices. There was also a sense that with rates having been close to zero for so long markets were indulging in a lot of wishful thinking that central banks would ride to the rescue as soon as the going got tough. This has become more so since the start of Q3, even though some of the more outlandish rate hike forecasts haven’t quite panned out as expected with pricing about the Bank of England terminal rate coming down from levels well over 6%, to where we are now at 5.25%.
At the end of the last quarter, it was suggested we could see further shocks start to play out as the effects of higher rates started to become more apparent, as more and more people come off fixed low rates, and have to face the reality of more normal rates of interest. The economic data we’ve seen over the last few months has started to bear this out with sharp slowdowns in recent PMI data from both the manufacturing and services sector, while there is evidence that the sharp slowdown in inflationary pressure that we’ve seen since last year’s peaks is starting to bottom out.
Another big fly in the ointment is the decision by OPEC+ or more accurately Saudi Arabia and Russia to cut oil production output and ostensibly hold the world to ransom when it comes to oil supply, pushing crude oil prices up by over 30% since the lows back in June, even as US oil production has risen to record highs of over 13m barrels a day. With $100 oil now looking inevitable, and interest rates likely to remain higher for longer to combat this inflationary impulse, the pressures on consumer incomes could well increase further, and that’s before we even consider the impact of another US government shutdown on a slowing US economy. We are already seeing the consequences of the squeeze on consumer incomes with industrial action as workers try and restore some of the hit to their disposable incomes caused by the rise in prices and rate rises of the last couple of years.
While it’s quite likely that the Bank of England and the European Central Bank are done when it comes to their rate-hiking cycle, the same can’t be said for the Federal Reserve, where officials have been insistent that a further rate hike to 5.5% is coming in November, while JPMorgan Chase CEO Jamie Dimon suggested that a move to 7% might not be out of the question. This doesn’t come across as outrageous as it sounds at first glance, given how resilient the US economy has turned out to be this year, with unemployment still at multi-decade lows and weekly jobless claims still in the low 200,000’s. We’ve also seen some eye-watering pay settlements agreed in the last few months.
In the US, American Airlines pilots managed to agree an average 21% pay rise this year, with increases of 46% over a four-year period, while United Airlines pilots managed to achieve a 40% increase over four years. We’ve also seen logistics giant UPS agree a deal to increase the wages of its full and part time workers by well above the rate of inflation with a typical driver seeing an increase in wages and benefits of 20%.
Here in the UK average weekly earnings are now starting to rise above the level of CPI inflation, which remained steady at 7.8% in the three months to August. This figure disguises much higher increases in pay that we’ve seen across the board in other areas of the economy, where rises of between 15% and 25% have been common at the lower end of the income scale. This means that interest rates are likely to remain higher for longer in a move that saw Bank of England chief economist Huw Pill call for a “Table Mountain” approach to interest rates, essentially arguing that rather than crushing demand even further given the squeeze rising oil prices are having, rates are now likely to stay at current levels for months.
This shift in messaging is already being reflected in bond markets where we’ve seen yields move sharply higher on both sides of the Atlantic. The change in the Fed dots for next year has seen US 2-year yields push up towards the peaks we saw in June 2006, above 5.2%. US 10-year yields have also pushed higher, above their previous peaks of October last year at 4.33% and are now back at levels last seen in 2007 at 4.6%. We’ve seen a similar spike in UK yields, pushing above the Truss levels of last year with the UK 10-year peaking at 4.75% last month while the 2-year yield peak at 5.56% in July, although these peaks came about because markets were pricing in more rate hikes from the Bank of England.
Since this month’s surprise hold in rates, UK yields have come down quite a lot since then, however further downside could be hard to achieve if the Bank of England is unable to cut rates because of sticky core inflation. It is these concerns over stagflation, and a possible recession that has started to creep into market sentiment in the past few weeks as the prospect of higher rates for longer eats into valuations and the impact on valuations.
We’ve already started to see evidence that US markets might be particularly vulnerable given the sharp rise in US rates that we’ve seen in the past few weeks, with the resilience of the US economy somewhat counterintuitively feeding into this anxiety. The Biden Administration’s inflation reduction act isn’ t helping when it comes to inflationary pressures given that these fiscal measures are helping to put a floor under price pressures which means that rates may need to rise further.
The UK and EU aren’t implementing anywhere close to the amounts of money that the US is throwing at the energy transition, with the result that investment flows are heading into the US dollar, exerting downward pressure on the euro and the pound. Consequently, a weaker pound and euro doesn’t help to bring inflation down if anything it magnifies the difficulties that the ECB and Bank of England have in trying to bring it back to their 2% target.
Despite recent sterling weakness the pound is still higher year to date, while it is by no means the worst performer against the US dollar, that honour going to the Japanese yen which looks set to push well through the 150.00 level towards 160.00 in the absence of any significant intervention from the Bank of Japan. Weakness in the Chinese economy isn’t helping and the problems here with the property sector are unlikely to have a quick solution. There is also the problem of what happens if Chinese demand picks up and the effect that would have on oil and other commodity prices.
Which brings us to Q4 and what can we expect for the rest of the year when it comes to equity markets? As things stand the equity markets are still in positive territory for the year with US markets leading the way, with the Nasdaq 100 up over 30% year to date, and the S&P 500 up over 10%, however most of these gains have come about due to a strong performance in the tech sector, or so-called Magnificent 7, which includes Nvidia, Tesla and Meta Platforms.
European markets have lagged with the DAX and CAC 40 up over 9%, while the FTSE 100 hasn’t really gone anywhere since the end of last year. As far as the price action is concerned, the gains seen in US markets appear to be looking the most vulnerable, with some key technical indicators being broken on the S&P 500, and Nasdaq 100 putting these at risk of further declines, as yields and the US dollar continue to rise.
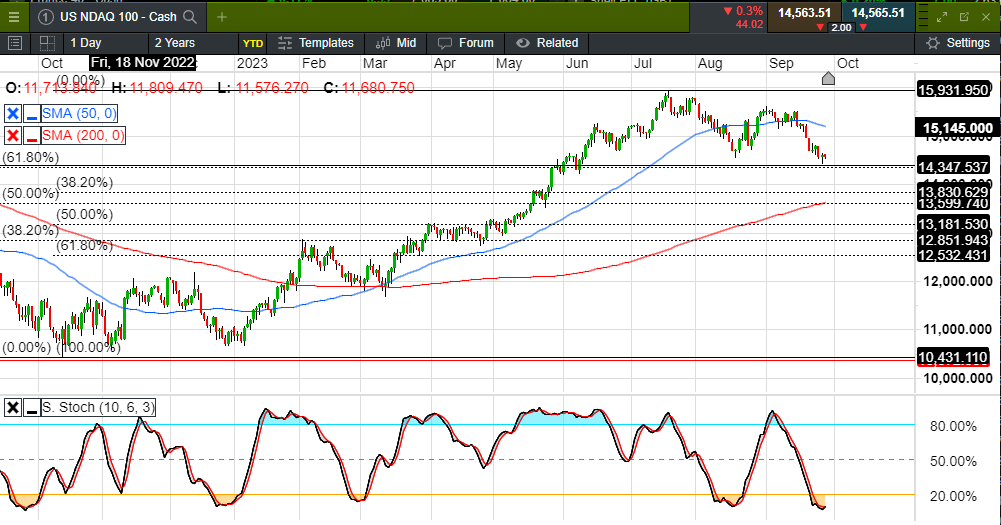
Nasdaq 100 daily chart
Source: CMC Markets
The resilience of the Nasdaq 100 since the October lows of last year has been all the more remarkable given the gains seen in the US dollar over the same period, as well as the rise in bond yields.
US 10-year yields have gone from 3.73% to 4.6%, while 2-year yields have risen another 100bps to levels well over 5%, however we are starting to see some evidence the price action might be breaking down. The 14,340 level could be an important support, while we still remain well above the 200-day SMA. It is clear that momentum is starting to wane with the 50-day SMA rolling over and we do have resistance at 14,830.
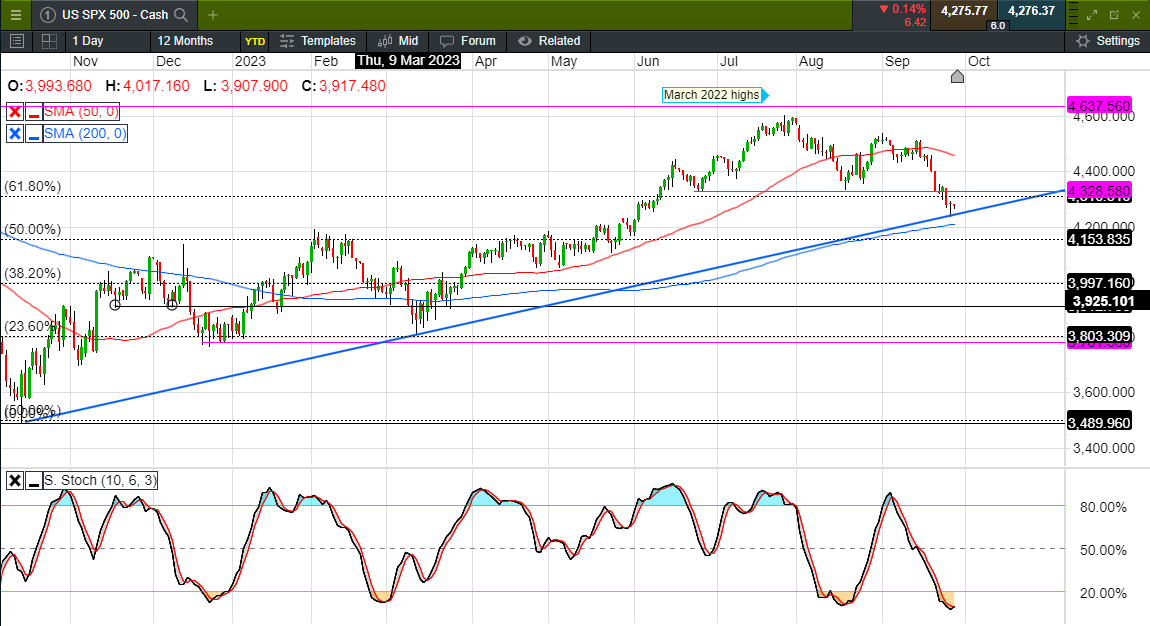
S&P 500 daily chart
Source: CMC Markets
The S&P 500 is looking slightly more vulnerable to further losses having broken below the August lows at 4,330, and is currently testing key trend line support from the October lows last year, as well as the 200-day SMA, which is also a key level.
A break of both of these key levels could prompt further weakness towards 4,100, however the risk for now is that we could see a rebound back to 4,400 ahead of next week’s payrolls numbers given the current oversold nature of the market.
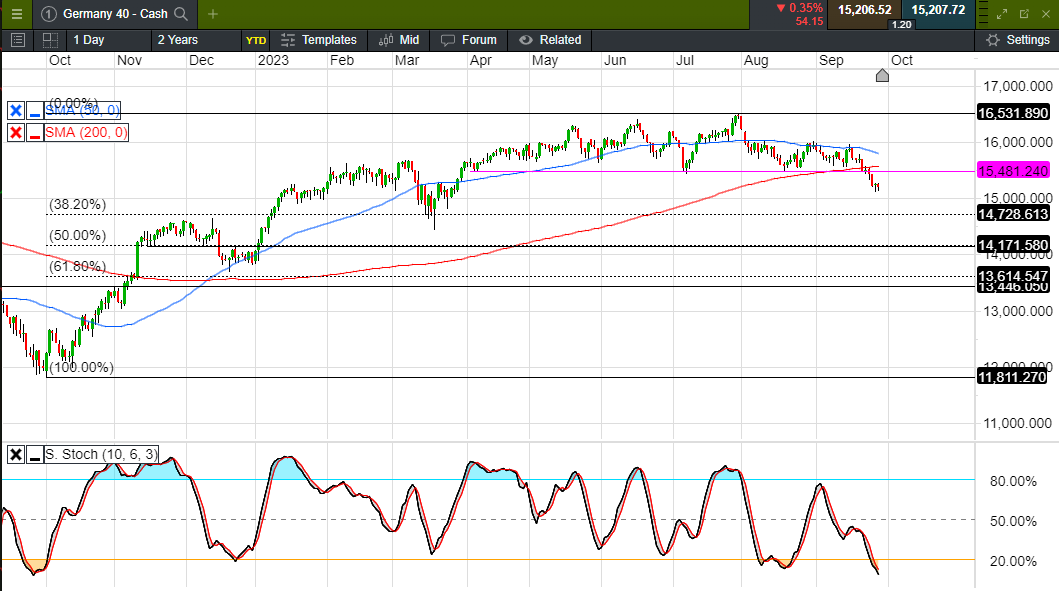
DAX daily chart
Source: CMC Markets
The way the DAX has behaved over the past month has been particularly interesting having broken out of its range of the last few months, breaking below the lows of April, July and August at 15,480 and also slipped below the 200-day SMA for the first time since November last year.
The risk now is that we could slip back to the March lows between 14,500 and 14,700 area. To stabilise we need to see a move back above the 200-day SMA and the 15,480 area.
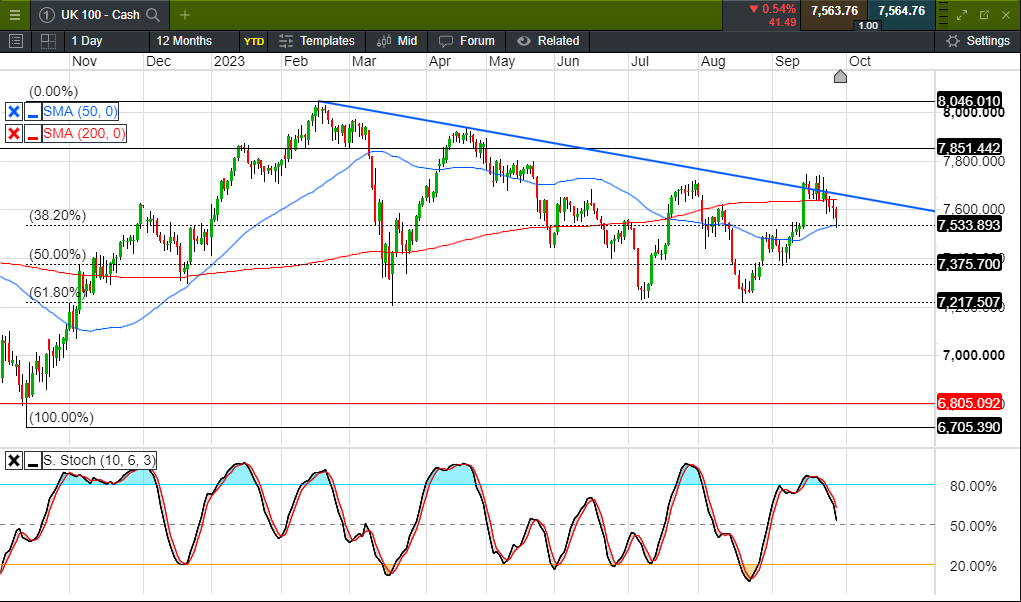
FTSE 100 daily chart
Source: CMC Markets
The FTSE 100 has found a significant area of support all of this year at the 7,200-area prompting a rebound on each occasion.
We thought we might get a break higher in September when we moved above trend line resistance from the February highs, and traded up to 7,750 but this has run out of steam. Since then, we’ve slipped back, however given how poorly the FTSE 100 has performed for most of this year there is a sense that any downside could well be limited in the current environment even if we do see further weakness in the likes of the DAX, S&P 500 and Nasdaq 100.
As we look ahead to Q4 the key question for investors now is whether the continued increase in oil prices translates into a prolonged period of stagflation, where rates have to stay higher for longer, slowing economic growth to the point we could see that turn into a recession, thus increasing the risk of further weakness in equity markets.
Disclaimer: CMC Markets is an execution-only service provider. The material (whether or not it states any opinions) is for general information purposes only, and does not take into account your personal circumstances or objectives. Nothing in this material is (or should be considered to be) financial, investment or other advice on which reliance should be placed. No opinion given in the material constitutes a recommendation by CMC Markets or the author that any particular investment, security, transaction or investment strategy is suitable for any specific person. The material has not been prepared in accordance with legal requirements designed to promote the independence of investment research. Although we are not specifically prevented from dealing before providing this material, we do not seek to take advantage of the material prior to its dissemination.


