Crude oil and gold markets have been choppy in recent weeks, but downward trends could resume for both commodities in the near term.
Crude oil could dip
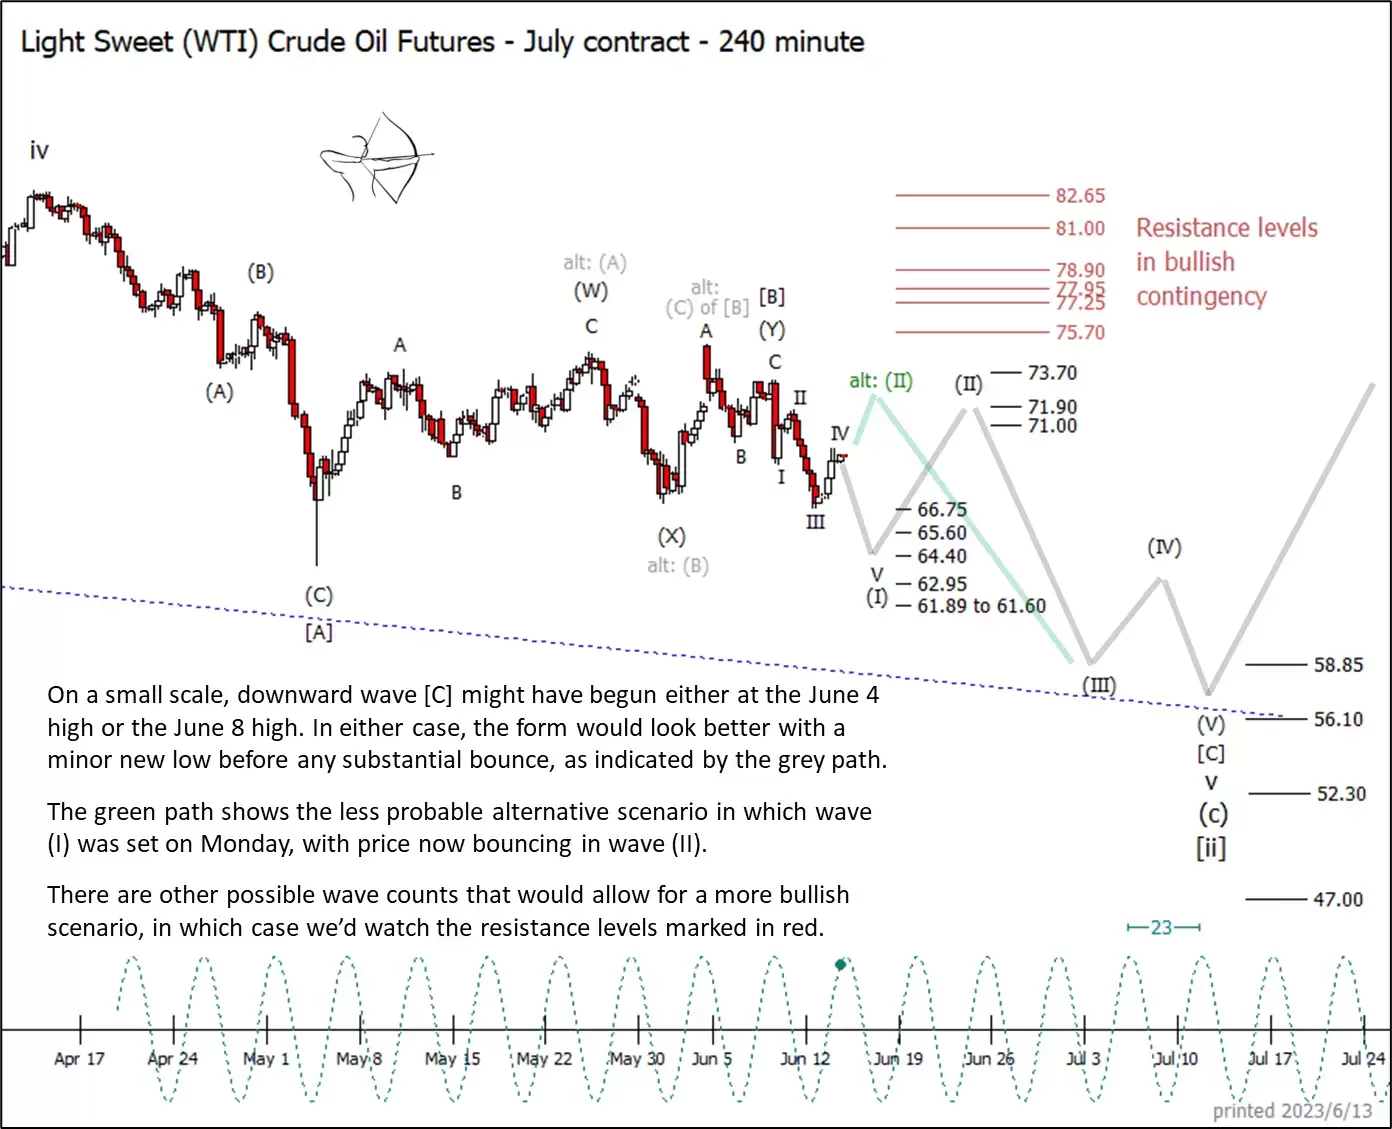
The near-term bearish case is stronger for US oil benchmark West Texas Intermediate (WTI), as depicted by the grey path on the chart below. The pattern down from the high of wave [B] would look better with a new low for wave (I) seated among the supports indicated between $66.75 and $61.60 a barrel. This is true for both our primary (grey) and alternative (green) paths for wave [B] on the chart.
The alternative path shown in green, below, reflects the possibility that wave (I) might already be complete, with price currently bouncing in wave (II). If price follows the green path this week, it would leave the decline from early June looking more corrective than impulsive. That would increase the probability that the rest of the decline will follow an ending diagonal pattern into the low of wave [ii] instead of an impulsive pattern, and it would make it more difficult for price to reach the lowest supports shown on the chart.
Gold loses its glitter
Gold prices have mostly stayed within a channel since early May. We view the recent test of the upper channel boundary as a probable fourth wave of a downward impulse. The easiest path this week and next week is likely to be downward, testing supports near $1,921 or $1 910 an ounce, and possibly lower.
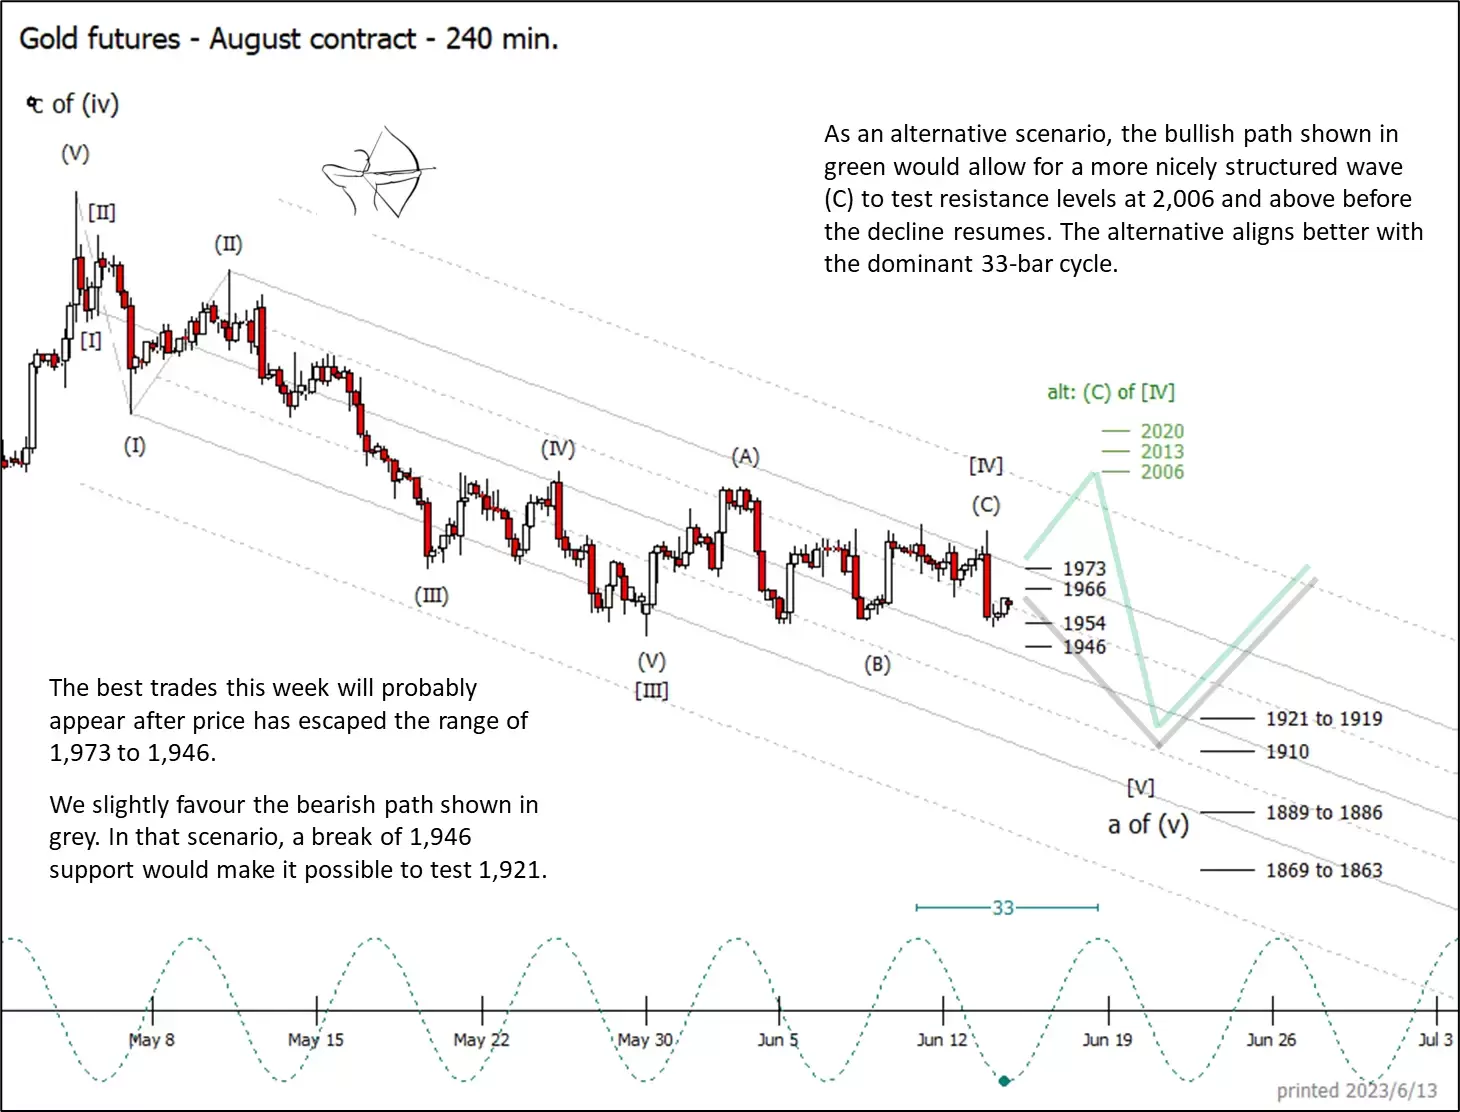
The near-term bullish alternative path drawn in green on the above chart would allow for a cleaner impulsive sub-wave (C) to finish wave [IV] of the decline. In that event, we would watch the resistance levels from $2,006 to $2,020 to cap the move.
For more technical analysis from Trading On The Mark, follow them on Twitter. Trading On The Mark's views and findings are their own, and should not be relied upon as the basis of a trading or investment decision. Pricing is indicative. Past performance is not a reliable indicator of future results.
Disclaimer: CMC Markets is an execution-only service provider. The material (whether or not it states any opinions) is for general information purposes only, and does not take into account your personal circumstances or objectives. Nothing in this material is (or should be considered to be) financial, investment or other advice on which reliance should be placed. No opinion given in the material constitutes a recommendation by CMC Markets or the author that any particular investment, security, transaction or investment strategy is suitable for any specific person. The material has not been prepared in accordance with legal requirements designed to promote the independence of investment research. Although we are not specifically prevented from dealing before providing this material, we do not seek to take advantage of the material prior to its dissemination.


