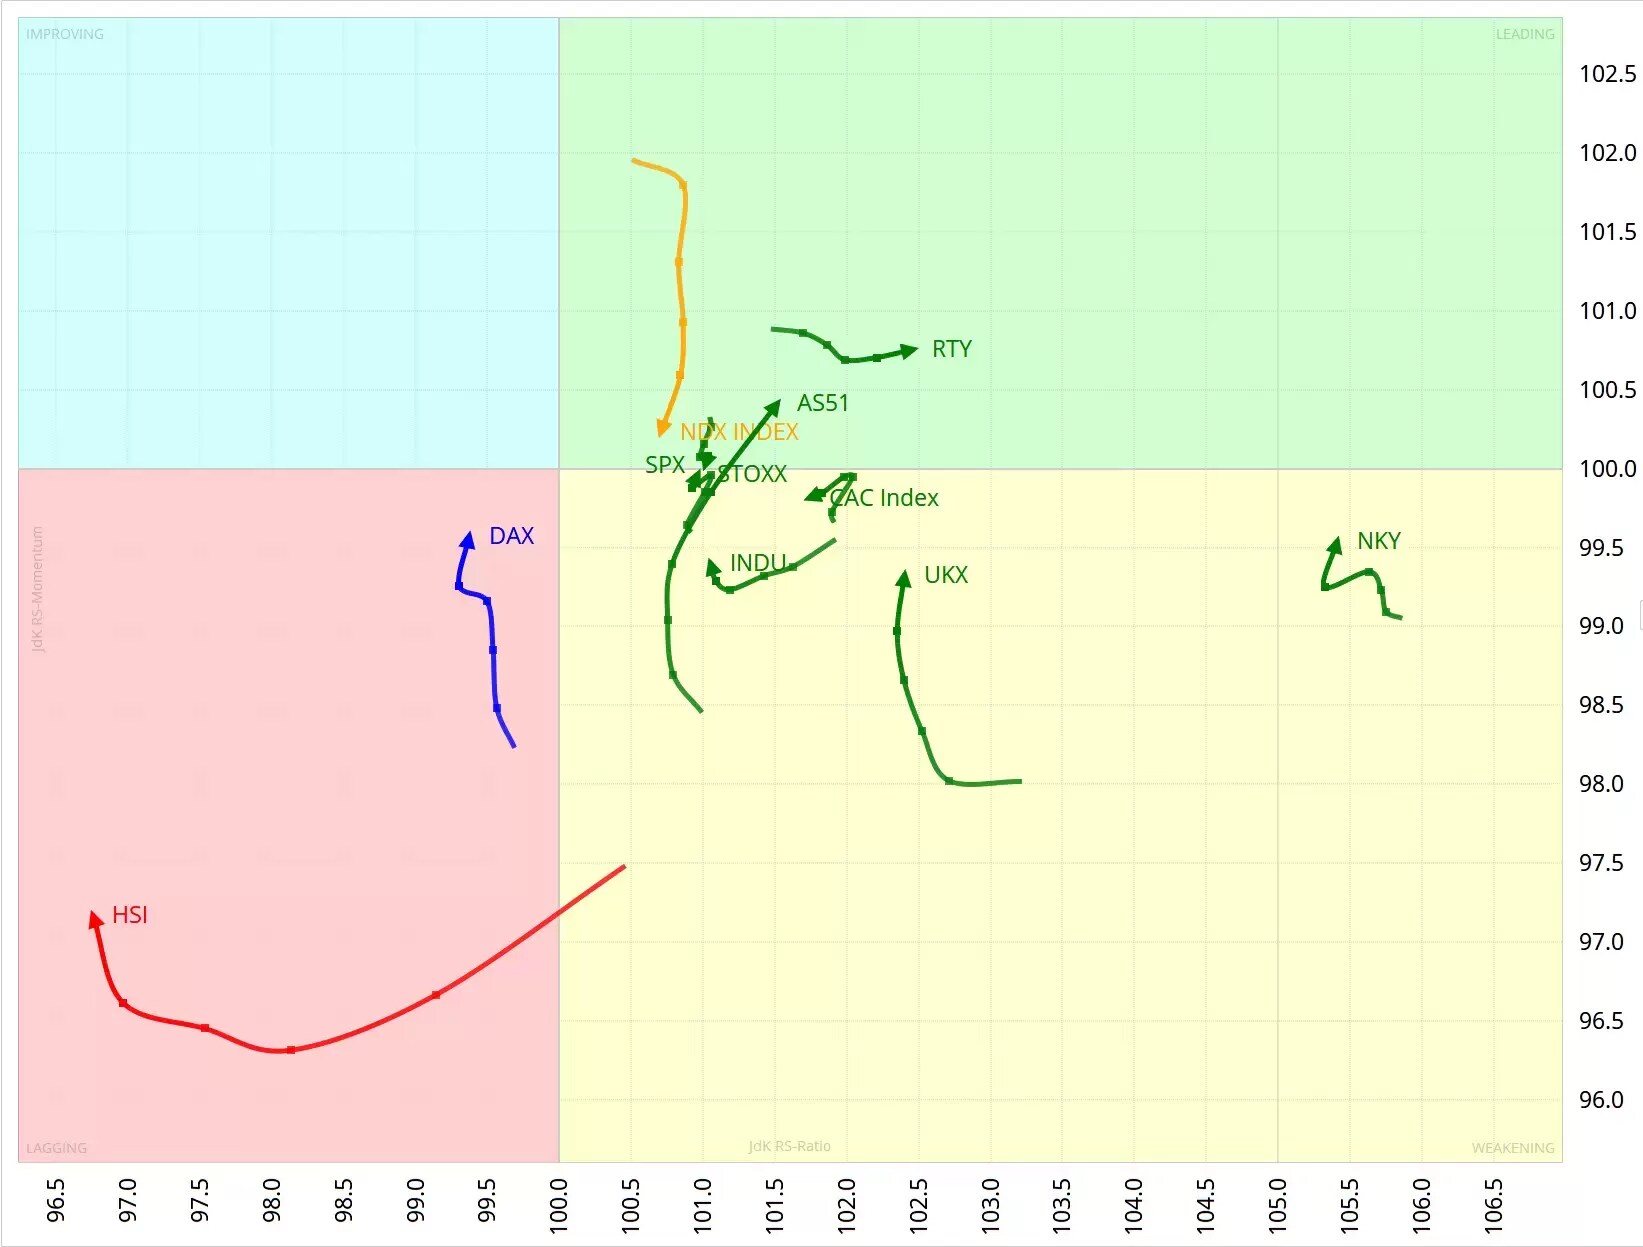
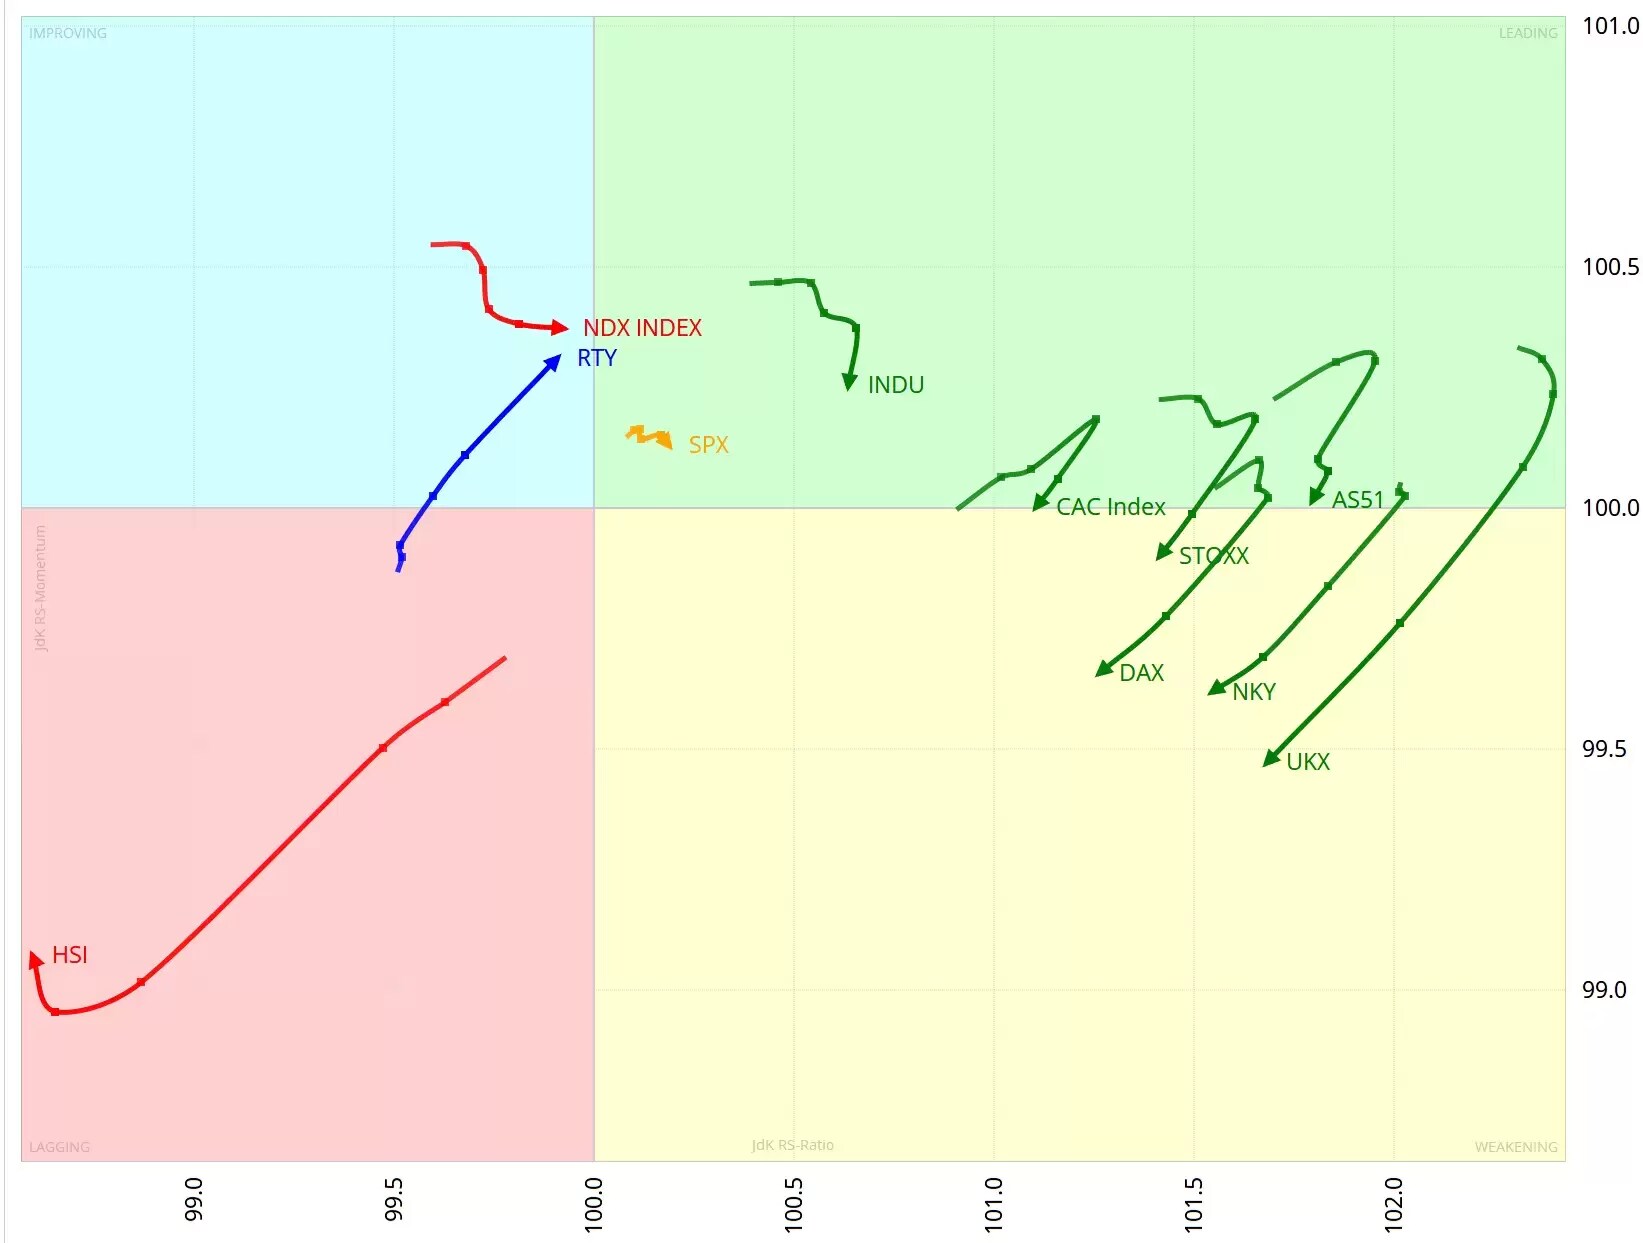
The weekly Relative Rotation Graph (RRG) of major global indices versus the MSCI World Index [MXWO]shows us that most indices are right of the 100 jdk RS-Ratio. The DAX, and the poor old Hang Sang index (HSI), are left behind.
Hang Seng’s struggles
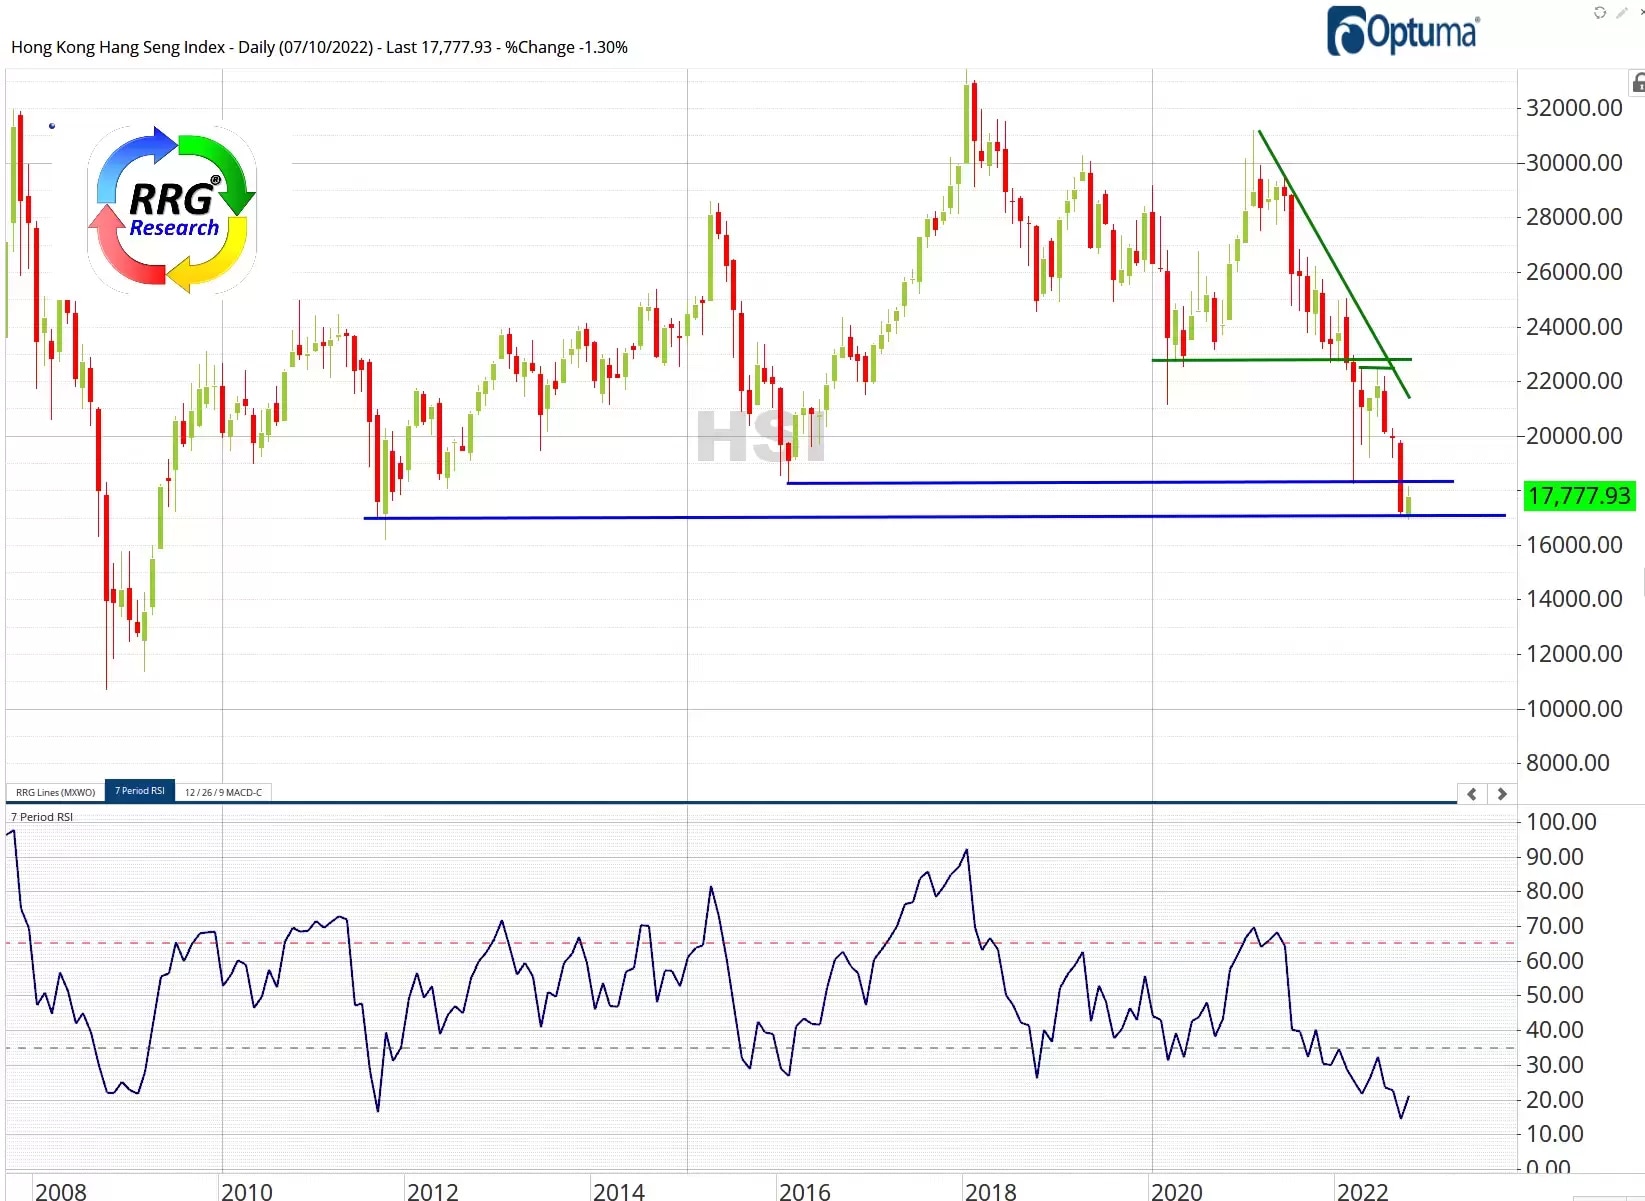
The monthly chart below illustrates how bad it is for the Hang Seng – and how bad it can still get. The breakdown of the 29,016 low to 18,200 was awful, and it has now fallen to test the 2011 low.
The relative strength index (RSI) indicates we’re deeply oversold, and vulnerable to a bounce at this support level. But the RSI gets a reading of 20% because the security is weak. If 16,600 gives way, the next support is the 2008 low at 12,000.
US stocks scan follow-up
Last week, we highlighted three potentially promising stocks in the general market collapse.

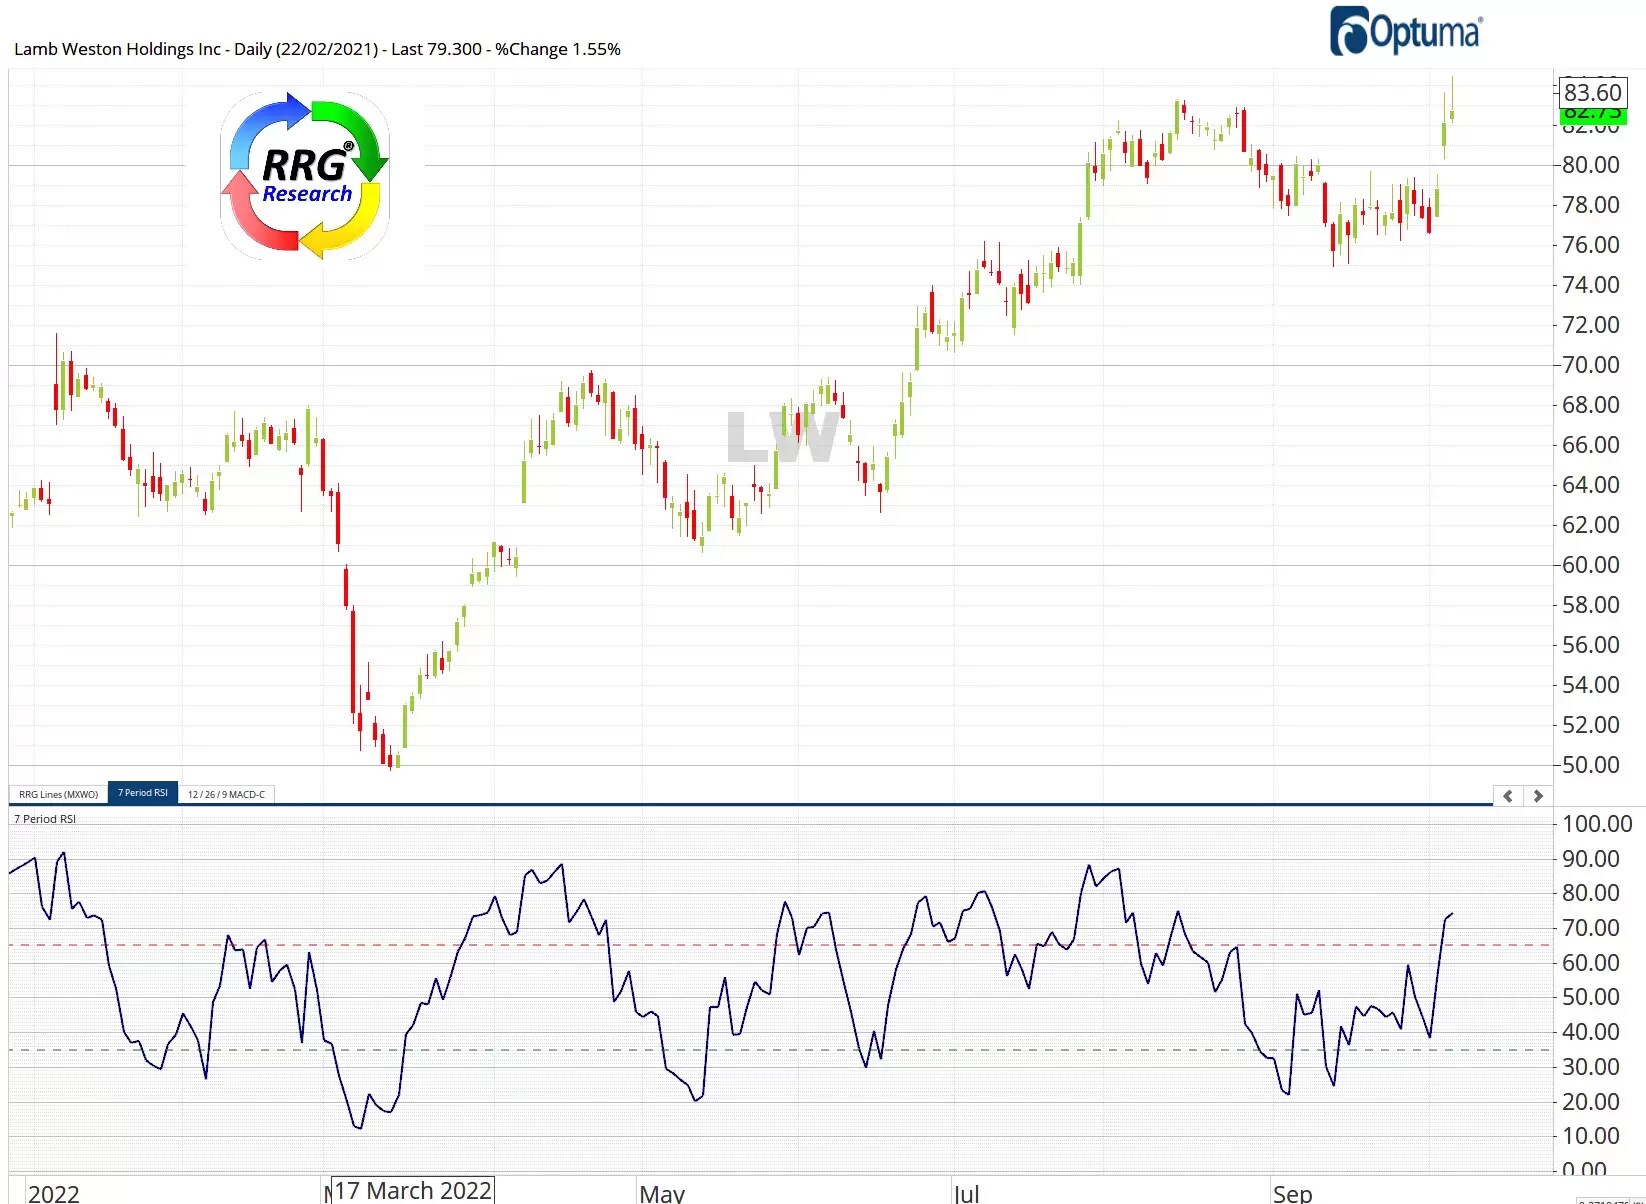
Lamb Weston [LW] held at the low and shot up strongly, and is ready to test resistance at its 82.75 high. A break out of this level could release more upside potential.
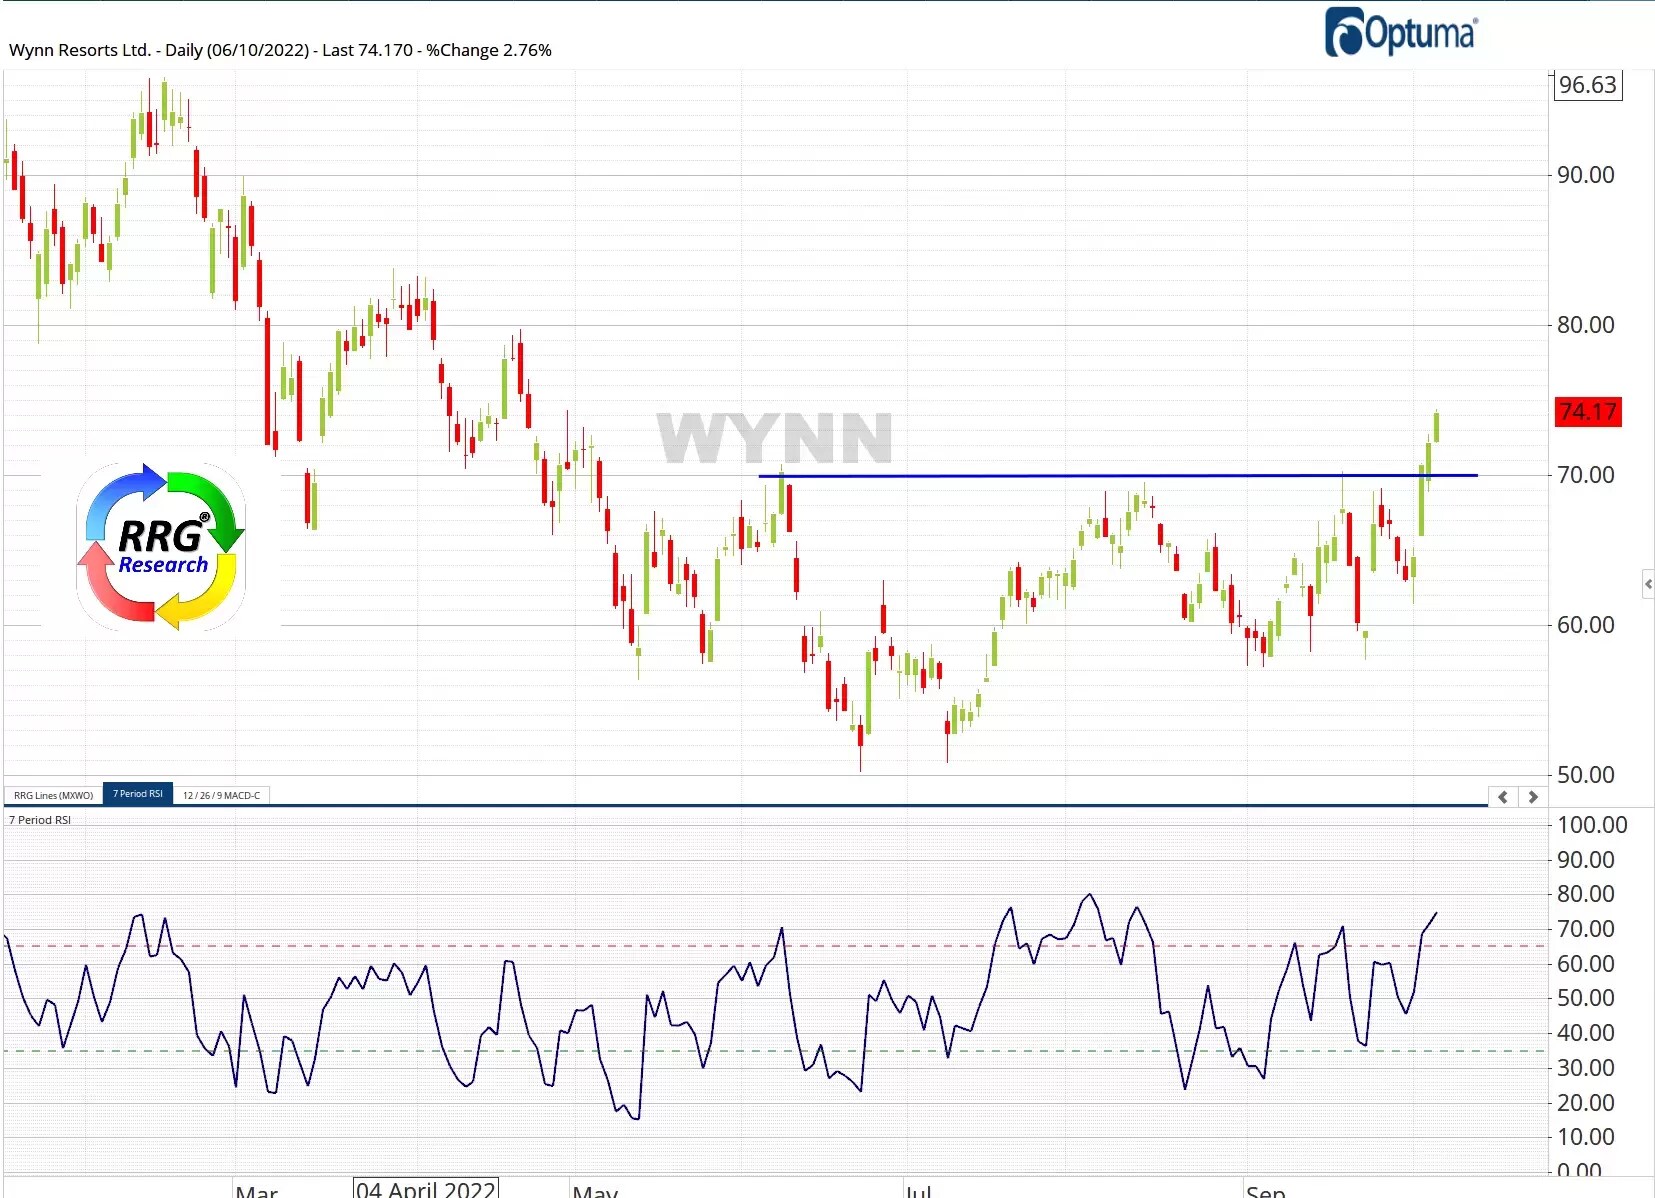
Wynn Resorts [WYNN] below, has broken its $70 resistance. It’s also at the neckline of its reverse head & shoulders pattern, which was formed in May. The head is also a double bottom, straddling June to July. The swing target from that was $70, which we’re now through.
We can set a new target from the reverse head & shoulders pattern. Measuring from the head to the neckline and swinging up, we get $90. This level is also resistance at the February high.
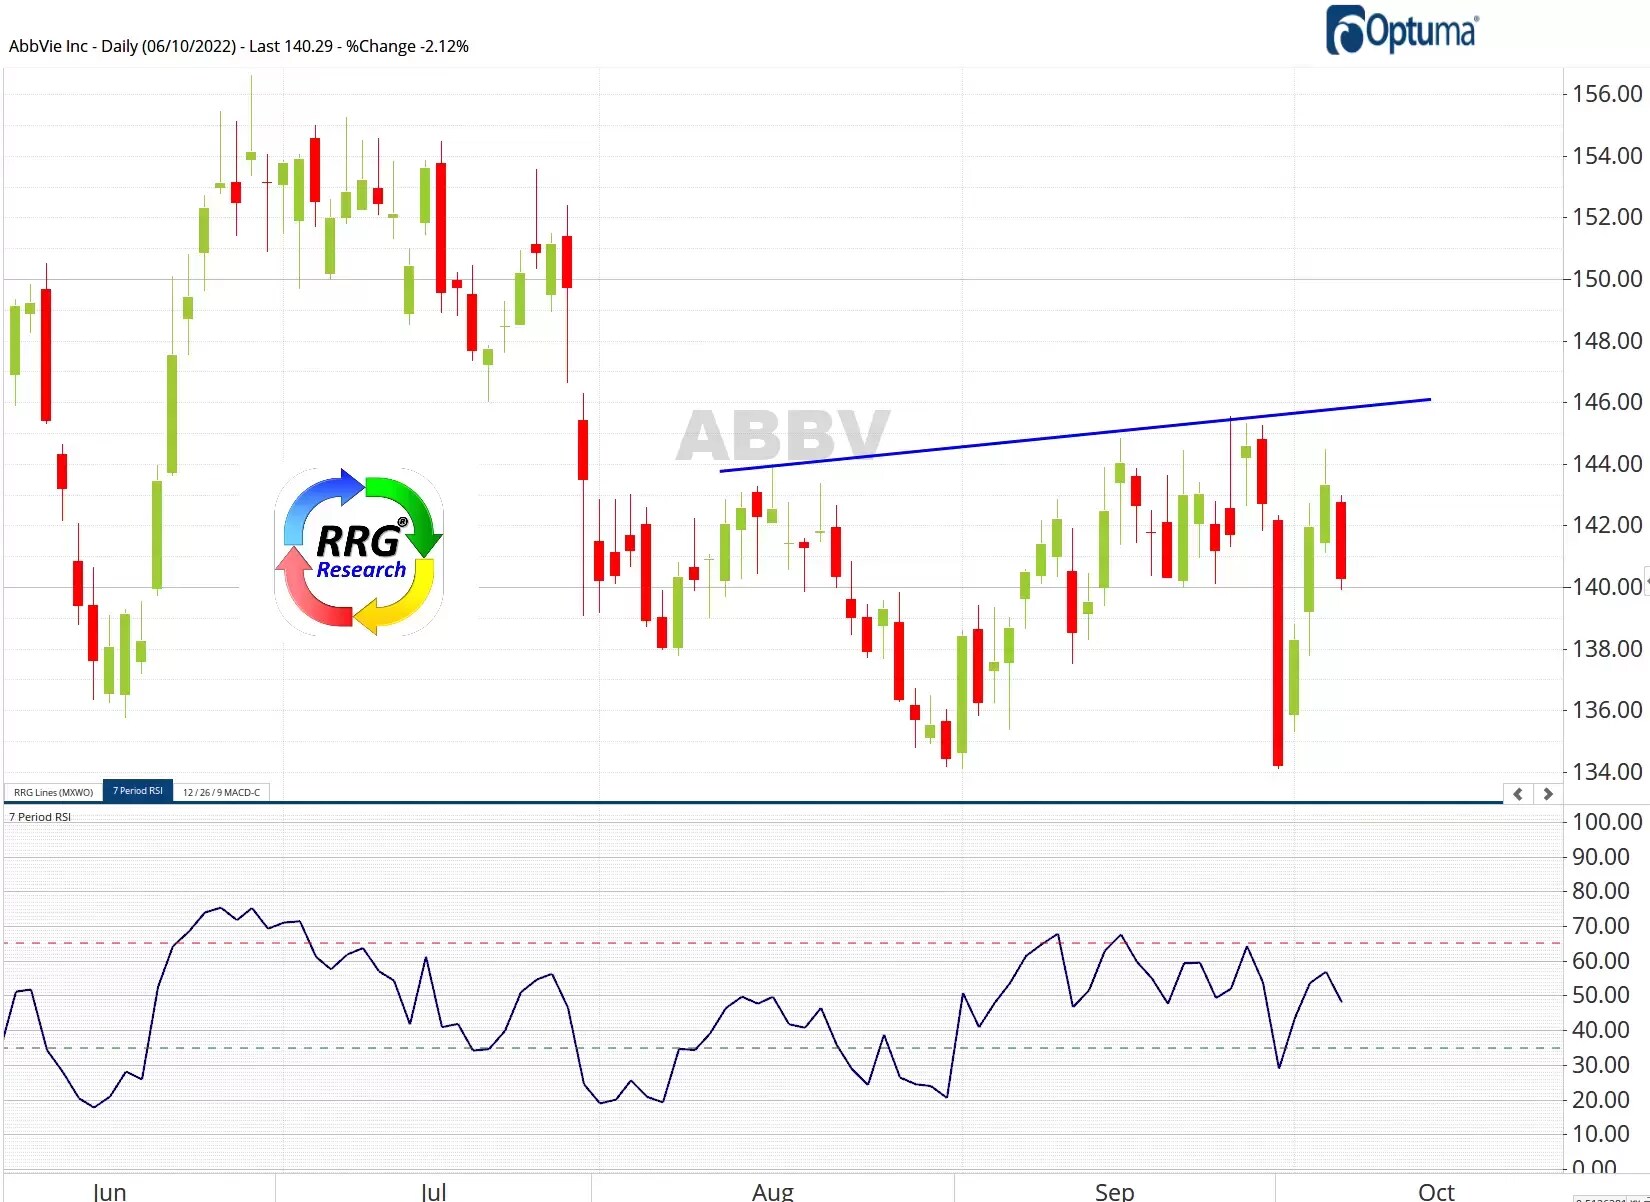
So, from the signals generated on the RRG scan on 22 September we say one as a potential reverse head & shoulders pattern, didn’t materialise. Another stock shot up to resistance, and may be about to make another leg higher, and the third looks to be at the start of, conceivably, a $20 move higher.
Scanning for bounce candidates in bear markets
Once the criteria we use for our RRG scans of major indices throws up single stock candidates, we then drill down to the regular chart, looking for confirming chart patterns and technicals.
One element that we always look for is the RRG-Heading on a tail. When a tail travels at an RRG-Heading between 0-90 degrees (southeast), it shows us that the stock is gaining in terms of relative strength, as well as relative momentum. This signals relative strength that is pushed up by increasing momentum.
A second element is RRG-Velocity. This is the distance between the observations on the tail. The longer the length, the stronger the move. More specifically, we’re looking for recently increasing RRG-Velocity.
Finally, at this stage, we’re scanning for potential long trades, which means we need stocks that go up in price. To find those, we added the requirement that a stock must trade above its 10-day moving average.
Summing this up, we’re looking for stocks that:
• Have rotated into a 0-90 degree RRG-Heading
• Have increasing RRG-Velocity over two time periods
• Are trading above their 10-day moving averages
Pricing is indicative. Past performance is not a reliable indicator of future results. RRG’s views and findings are their own and should not be relied upon as the basis of a trading or investment decision.
Disclaimer: CMC Markets is an execution-only service provider. The material (whether or not it states any opinions) is for general information purposes only, and does not take into account your personal circumstances or objectives. Nothing in this material is (or should be considered to be) financial, investment or other advice on which reliance should be placed. No opinion given in the material constitutes a recommendation by CMC Markets or the author that any particular investment, security, transaction or investment strategy is suitable for any specific person. The material has not been prepared in accordance with legal requirements designed to promote the independence of investment research. Although we are not specifically prevented from dealing before providing this material, we do not seek to take advantage of the material prior to its dissemination.


