As the US gears up for Thanksgiving, the key indicators I follow present a mixed bag, writes independent financial analyst Helene Meisler, whose recent trading masterclass for CMC Markets can be viewed here.
I expected to see less group rotation and more bullishness by now, but that is not the case. On a short term basis US markets are neither overbought nor oversold, but ping-ponging between the two. That’s what happens when you have two days down, one day up, and the market simply chops about.
As for the medium term, we are just now stepping into overbought territory. My estimation is that the market is slightly overbought on an intermediate-term basis, but could become fully overbought in early December.
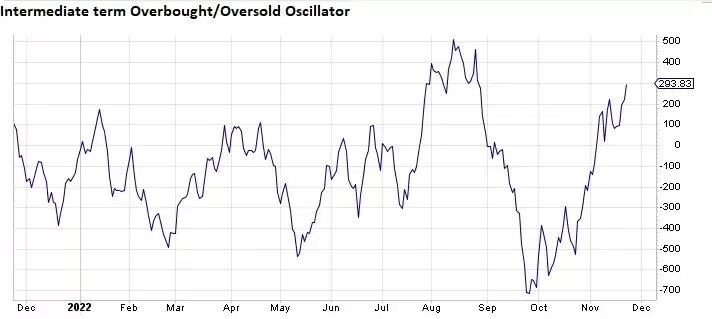
Just being overbought or oversold is no reason to force a trade. I need other indicators to confirm market direction. In an overbought environment, where we might look to sell short, it is helpful when the market internals and breadth indicators show negative divergences. It is also helpful when sentiment suggests that folks are leaning too bullishly.
Indices up, but fewer stocks post higher highs
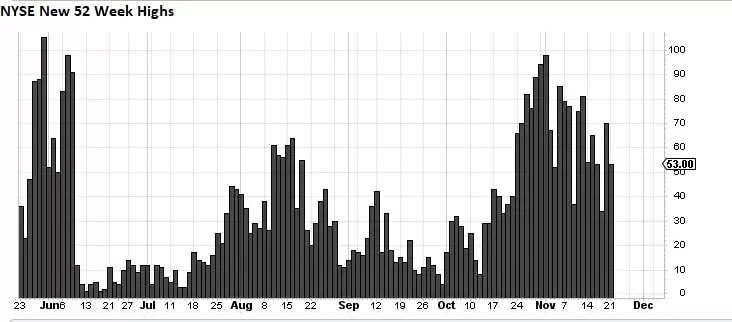
Let’s begin with the internals. In early November the NYSE had 98 stocks making new highs, which I considered a good showing. The market then pulled back and rallied again on the better-than-expected CPI report. The S&P 500 set a higher high, compared to early November, yet only 81 stocks made new highs. That tells me that the buying interest in late October, which brought us those 98 new highs, was waning.
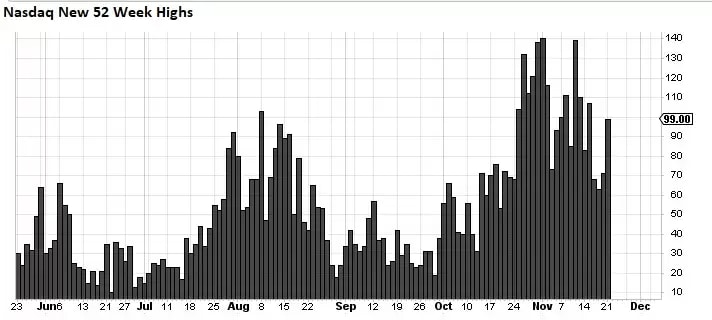
The Nasdaq registered 140 new highs in early November. By mid-November this number had dropped to 139. I realise that sounds like nit-picking, but the Nasdaq was 750 points higher than it was in early November, so we should have seen this figure expanding, not contracting, as the index rose. Chalk up new highs as a negative divergence.
Then there is overall breadth, which has been keeping pace. It has neither led nor lagged. We’ll just call it confirming.
Sentiment seemed pretty complacent in the week prior to the FTX Crypto collapse, but that sent some of the bullishness back on its heels. It is fairly typical for the US market to rally in the week of Thanksgiving. If there is a rally this week, I suspect we’ll see that complacency creep back in, especially if technology stocks rally. Investors always seem to get more bullish when tech rallies.
Key ratio trending lower since October
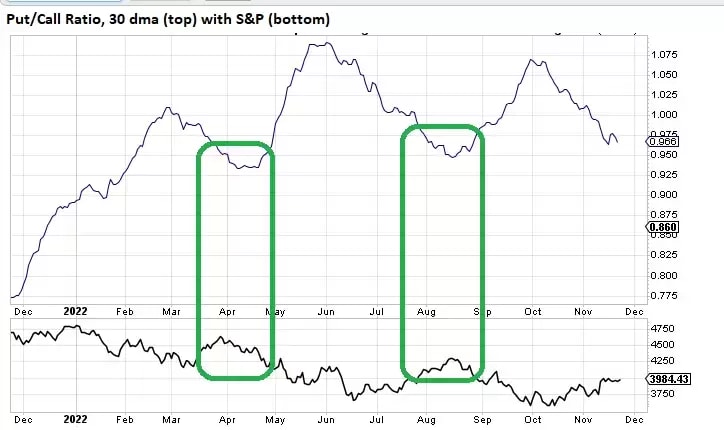
Take a look at the 30-day moving average of the put/call ratio, below. Peaks in this indicator tend to correspond with lows in the stock market, while lows in the indicator are often associated with peaks in the market. I have boxed off in green the two lows in the indicator this year: April and August. You can see that the indicator has been heading down since October. I am now on the lookout for the point at which it starts heading upwards That would tell me that complacency is baked in.
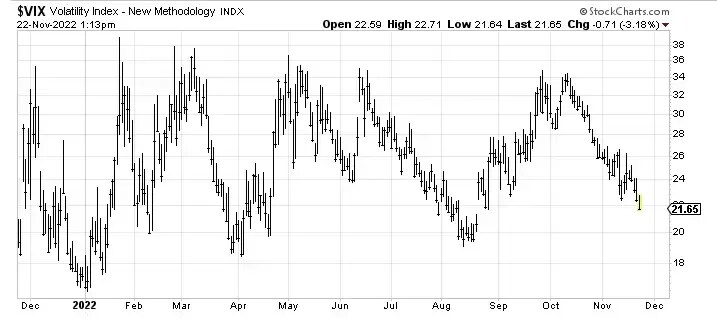
I also focus on the VIX, a key measure of market volatility. It is now heading down towards 20, an area that has been a low point for the majority of 2022. There are two indicators I follow for this. The first is a subscription-based sentiment indicator called the Daily Sentiment Indicator (DSI). This runs on a scale of 0-100. Readings between 10 and 90 tend to be neutral zones. However, a reading below 20 or above 80 could be deemed a “get ready to act” zone.
The DSI for the VIX got to the 11-12 area in late July and early August, so it never reached a true extreme. For me, though, it was close enough because the other indicators were lined up for a market pullback. The current DSI for the VIX is 21. If the market rallies in the remainder of this week and the VIX drops towards 20, it is possible that the DSI for the VIX could fall into the low- to mid-teens, putting it in “get ready to act” territory.
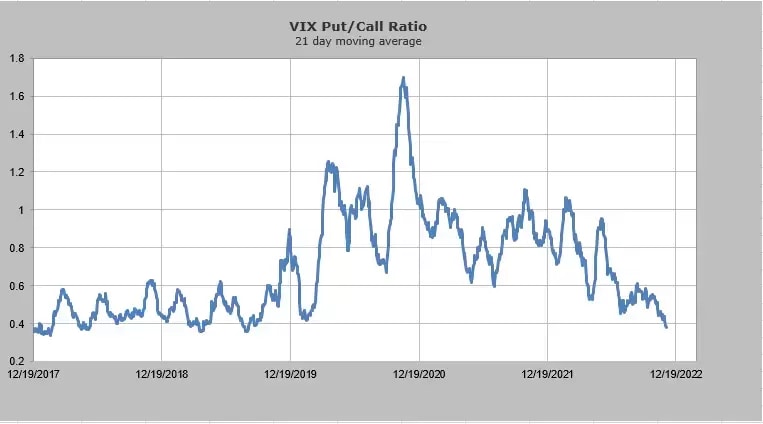
Then I monitor the put/call ratio for the VIX using a 21-day moving average, which is now at its lowest level since 2019. These options are typically played by pros, so instead of being contrarian I tend to respect their trades. In this case, there is far more call-buying than put-buying for the VIX.
In sum, if the market rallies this week or next, as I expect it to, and the number of stocks making new highs continues to disappoint, sentiment could become complacent and the DSI for the VIX could drop into the teens. That would suggest that December might be a volatile month, potentially resulting in a market pullback.
Click here to watch Helene's recent masterclass for CMC Markets. Helene Meisler's views and findings are her own, and should not be relied upon as the basis of a trading or investment decision. Pricing is indicative. Past performance is not a reliable indicator of future results.
Disclaimer: CMC Markets is an execution-only service provider. The material (whether or not it states any opinions) is for general information purposes only, and does not take into account your personal circumstances or objectives. Nothing in this material is (or should be considered to be) financial, investment or other advice on which reliance should be placed. No opinion given in the material constitutes a recommendation by CMC Markets or the author that any particular investment, security, transaction or investment strategy is suitable for any specific person. The material has not been prepared in accordance with legal requirements designed to promote the independence of investment research. Although we are not specifically prevented from dealing before providing this material, we do not seek to take advantage of the material prior to its dissemination.


