The average true range indicator was developed by technical analyst J. Welles Wilder as a volatility indicator for the commodities market. In addition, it can applied to any financial market that shows volatility, in particular, stocks, currency pairs and indices.
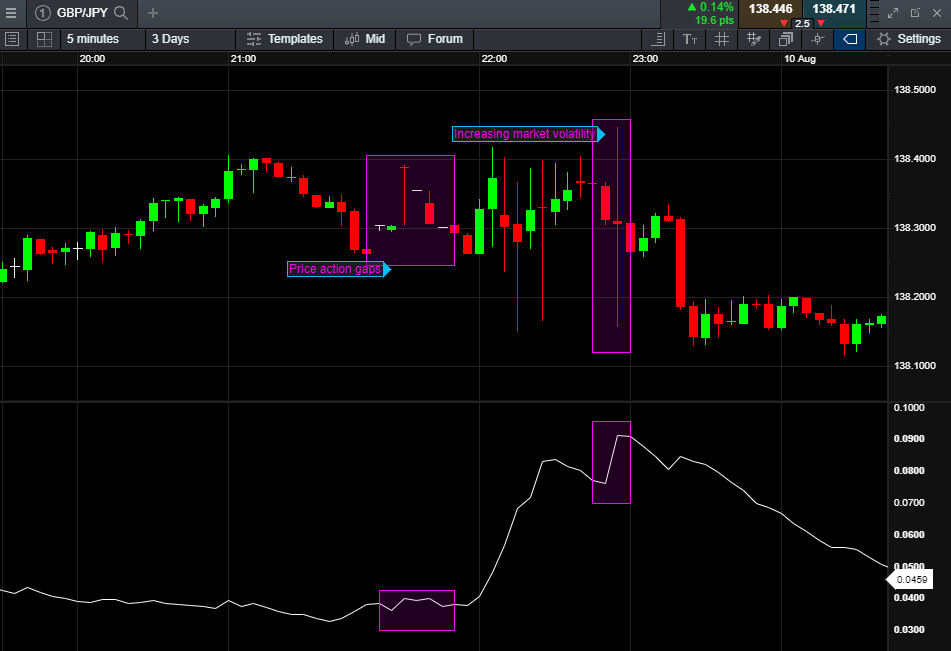
The average true range is plotted on a trading chart as a single moving average line, which is calculated by the true ranges. This is usually on a candlestick chart, where volatility and price gaps are easy to spot. These types of charts are useful as traders can use the charts to identify entry and exit points for their positions.
The general rule is that a high ATR value indicates a higher level of volatility, whereas a low ATR value indicates a lower level of market volatility. Please note that the average true range does not represent or suggest market trends, only volatility and price gaps. As always, technical indicators tend to work well in conjunction with others; in this case, an indicator that could be used alongside the average true range to measure trend strength is the average directional index (ADX), also created by Wilder. This will ensure that all aspects of price action, trend and market volatility are covered for a comprehensive trading strategy.


