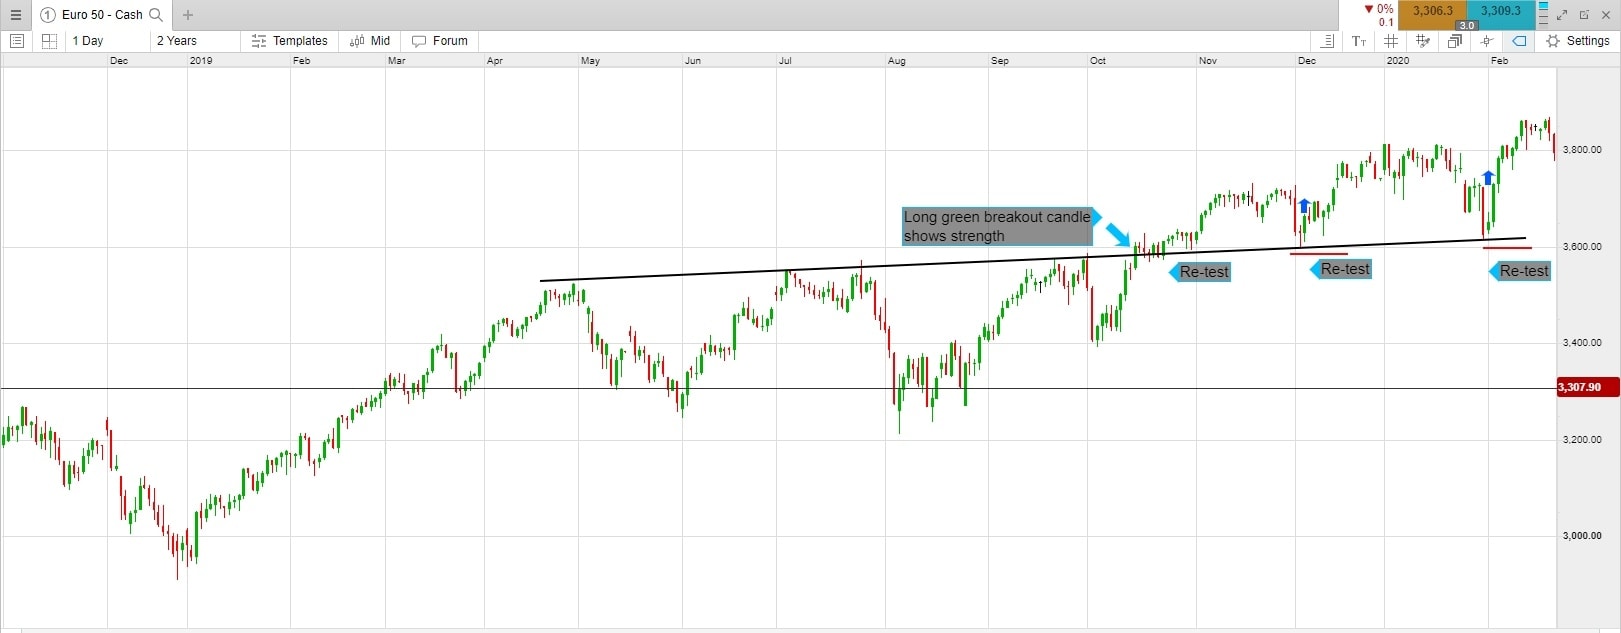
A stock market breakout or a breakout in a specific share is a tradable event that some active investors can base an entire strategy around. A breakout is when a stock or stock index moves beyond a level of support and resistance that it has struggled to move above or below in the past. Learning how to identify and trade potential breakout stocks gives traders one more tool that they can use to generate profits within an often-volatile market. Breakout stocks are shown on price charts, in particular, using candlestick trading to read price action.
Spread bets and CFDs are complex instruments and come with a high risk of losing money rapidly due to leverage. 69% of retail investor accounts lose money when spread betting and/or trading CFDs with this provider. You should consider whether you understand how spread bets, CFDs, OTC options or any of our other products work and whether you can afford to take the high risk of losing your money.


