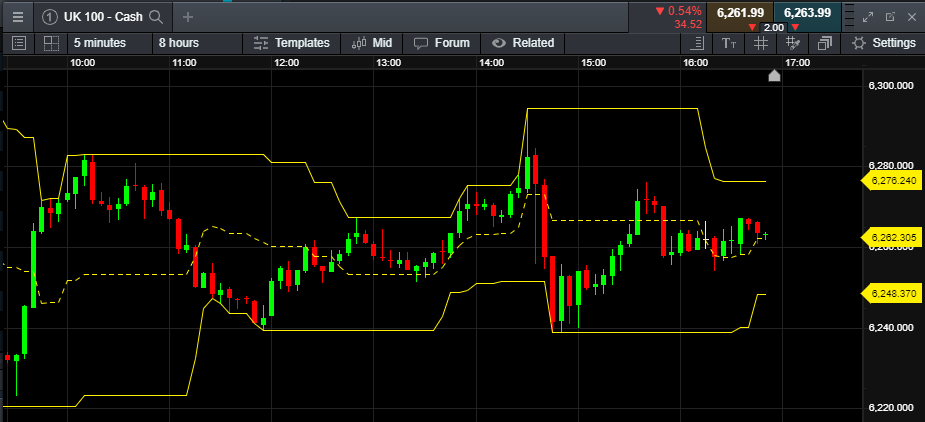
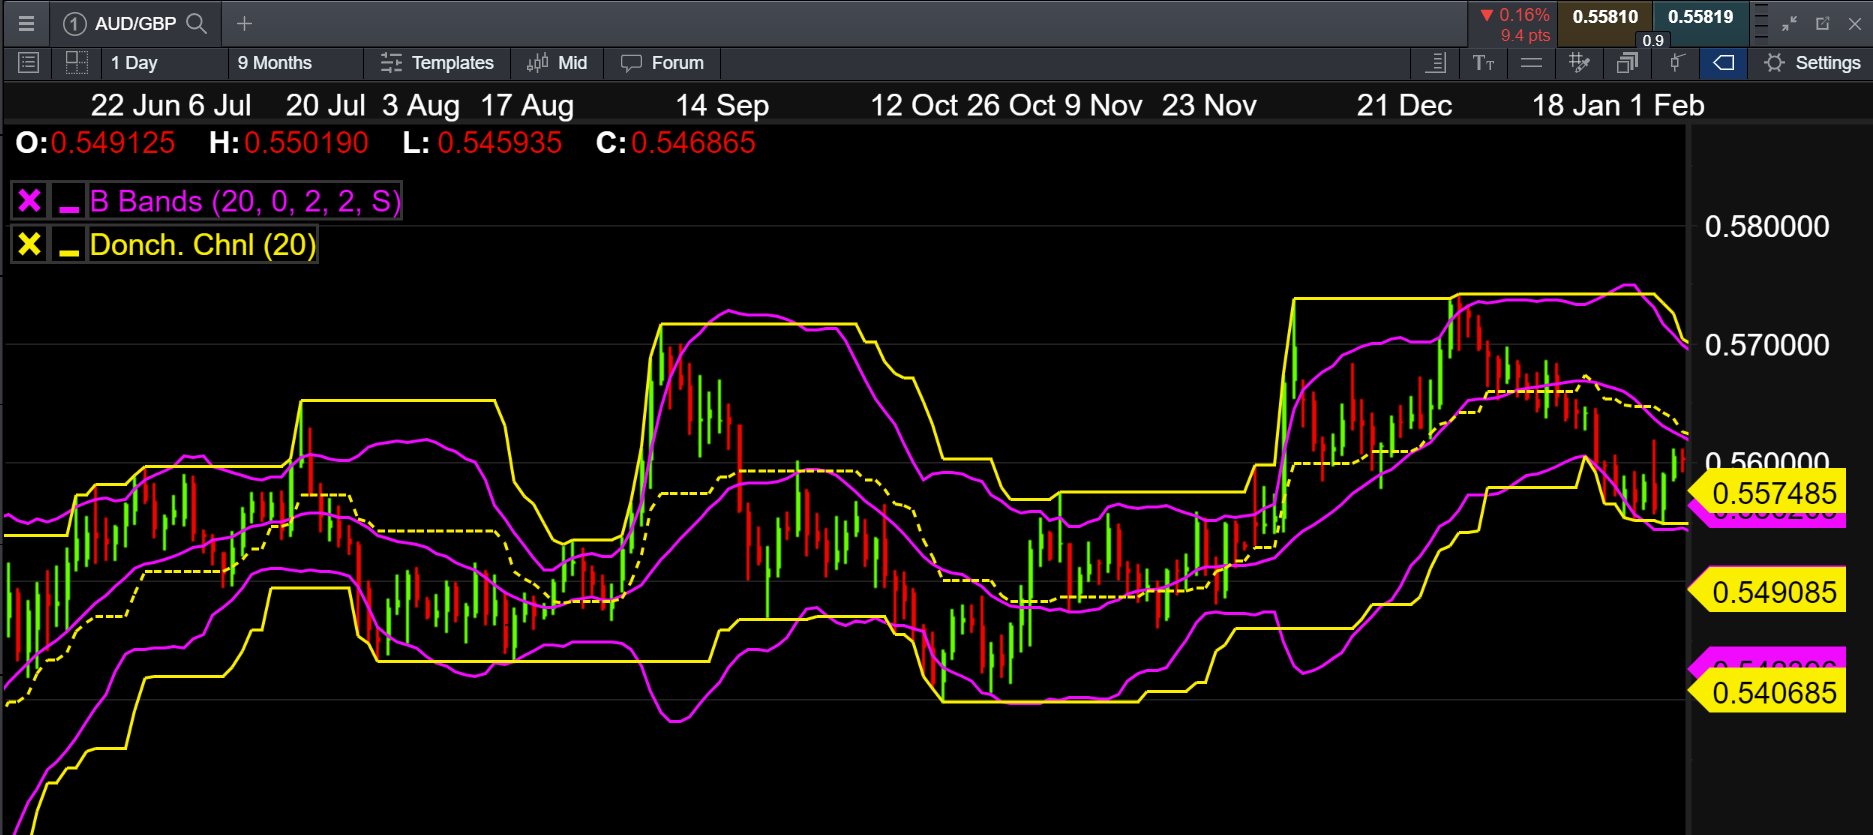
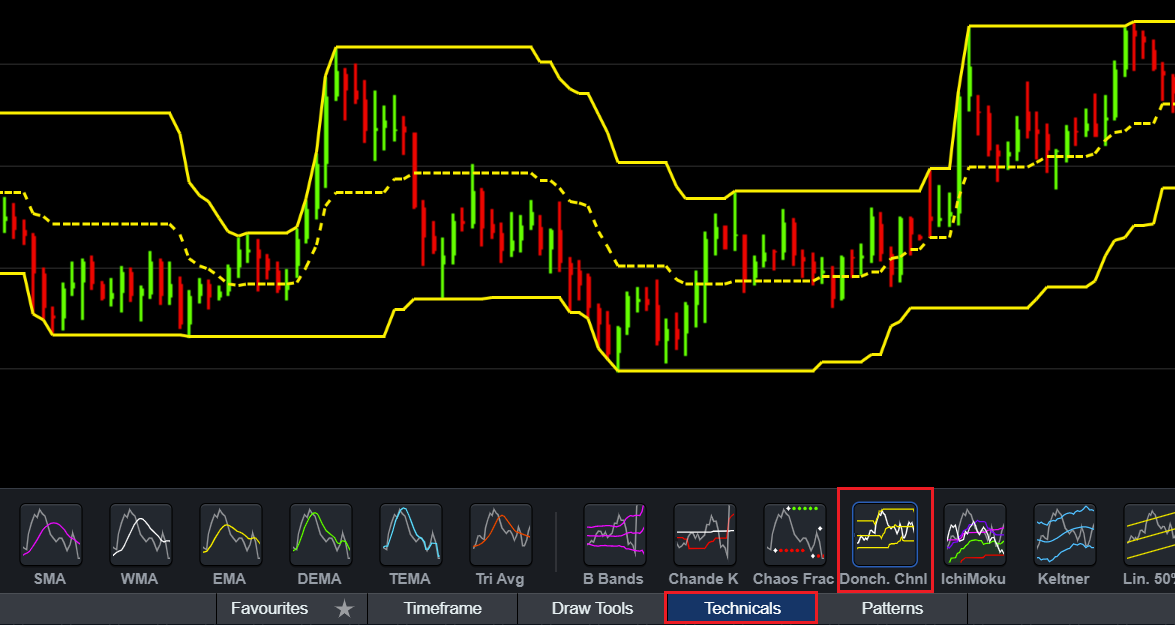
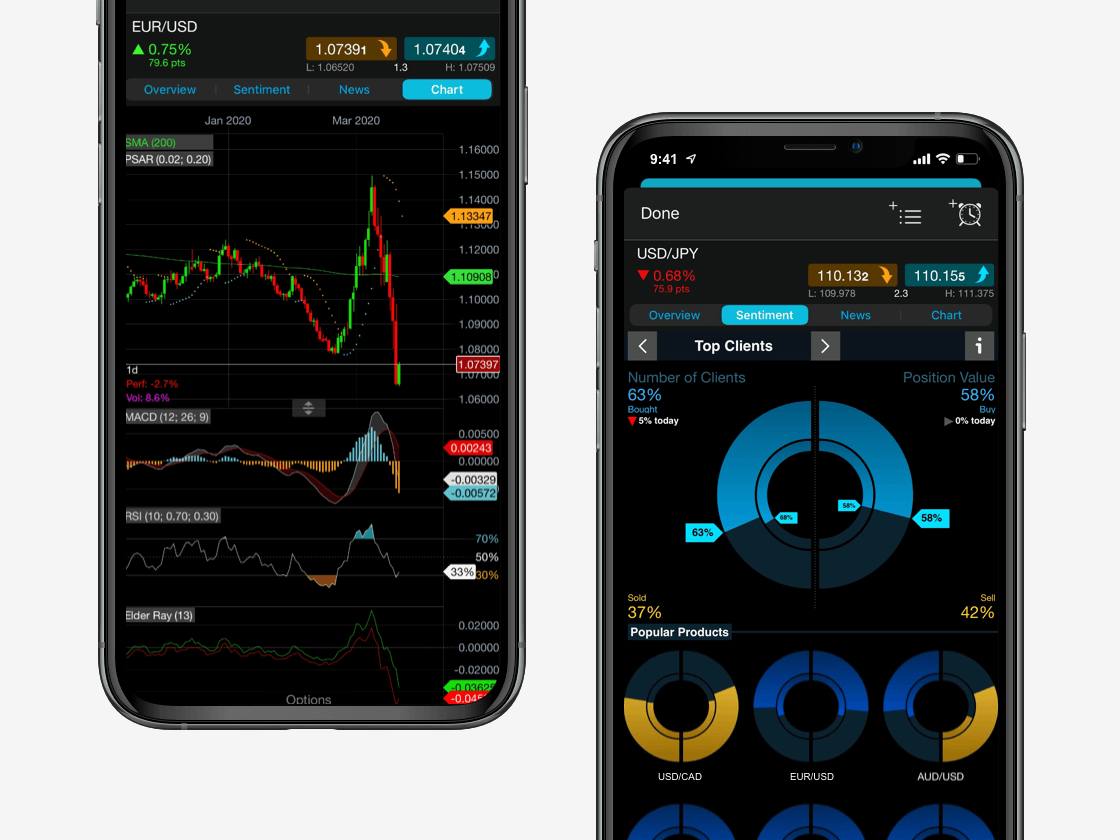
Donchian channels are made up of three lines: a moving average in the centre, an upper band and a lower band. The upper band measures the highest rise of an asset’s price, the lower band measures the lowest that the price drops to, and the moving average line represents the median or average price that an asset fluctuates between. This is based on a timeframe that can range from just a few minutes to a few months. Therefore, traders can rely on Donchian channels for both short-term and long-term measurement of trends.
The Donchian indicator aims to find relationships between the current and past price of an asset, to show whether there are bullish or bearish trends within a specific time period. The upper band represents the highest price an asset achieved, which is an indication of bullish energy, whereas the lower band represents the lowest price an asset achieved within tougher bearish reversals.


