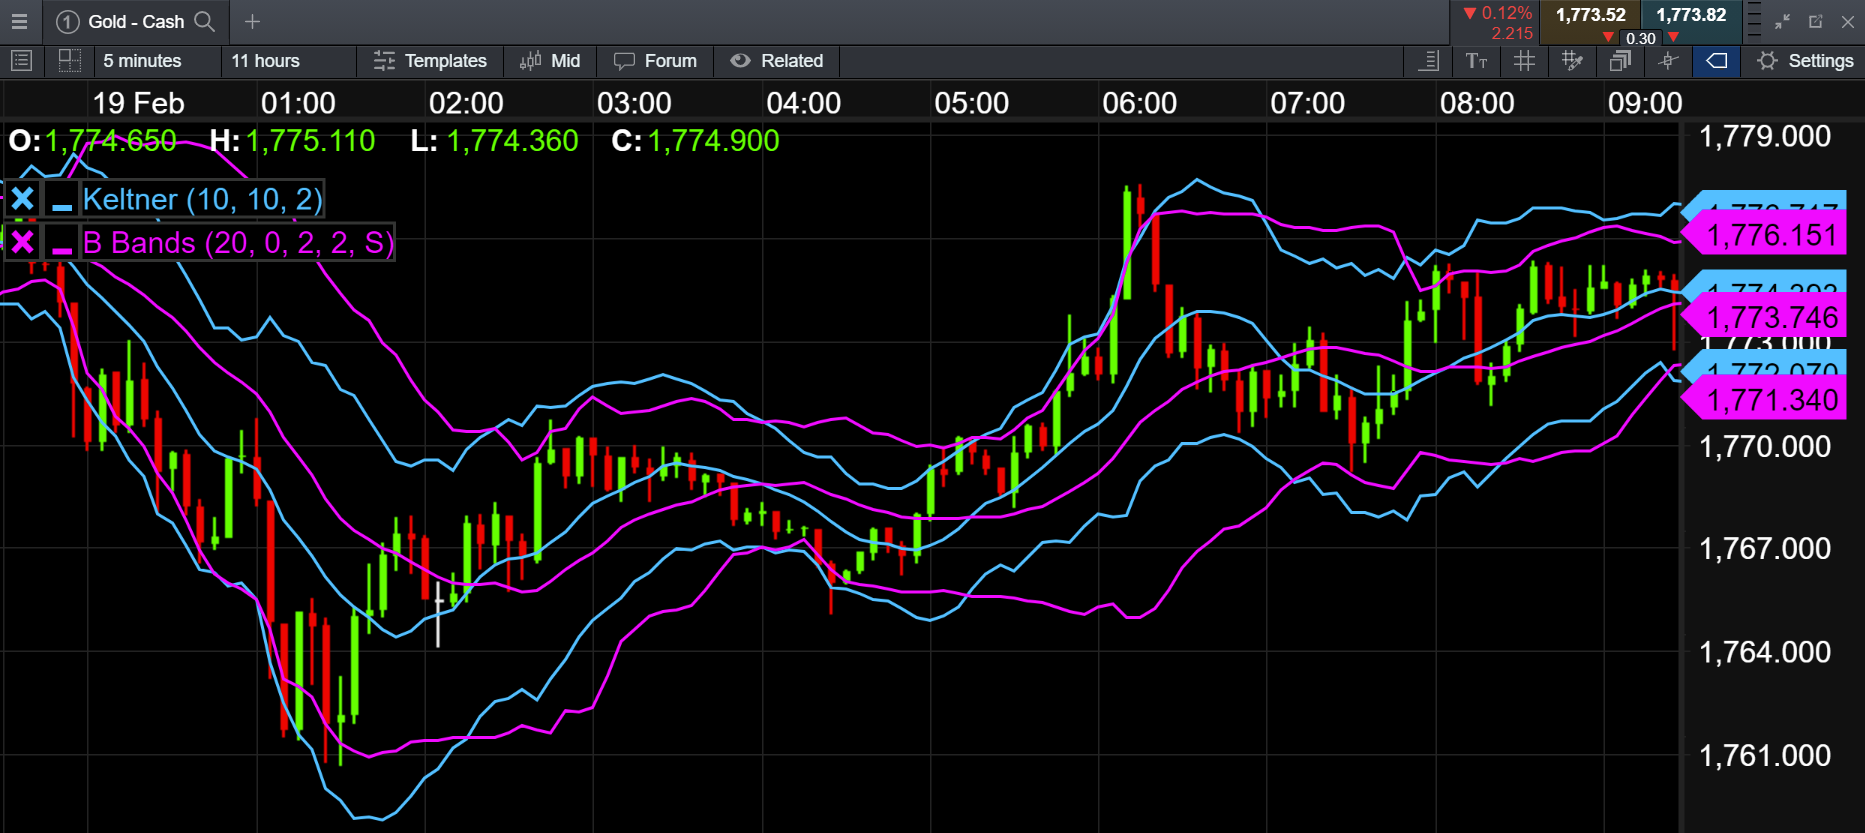
The Keltner technical indicator was first proposed by Chester Keltner in the 1960s with a more simple formula. Originally, it calculated the width of the bands by using only the simple moving average (SMA) and high-low price range, rather than the average true range that is used today. The present day indicator instead uses an exponential moving average (EMA) rather than SMA as the centre line to set the distance. The average true range (ATR), an independent volatility-based indicator, calculates the upper and lower bands. In general, the channels are typically set to two ATR values above and below a 20-day EMA.
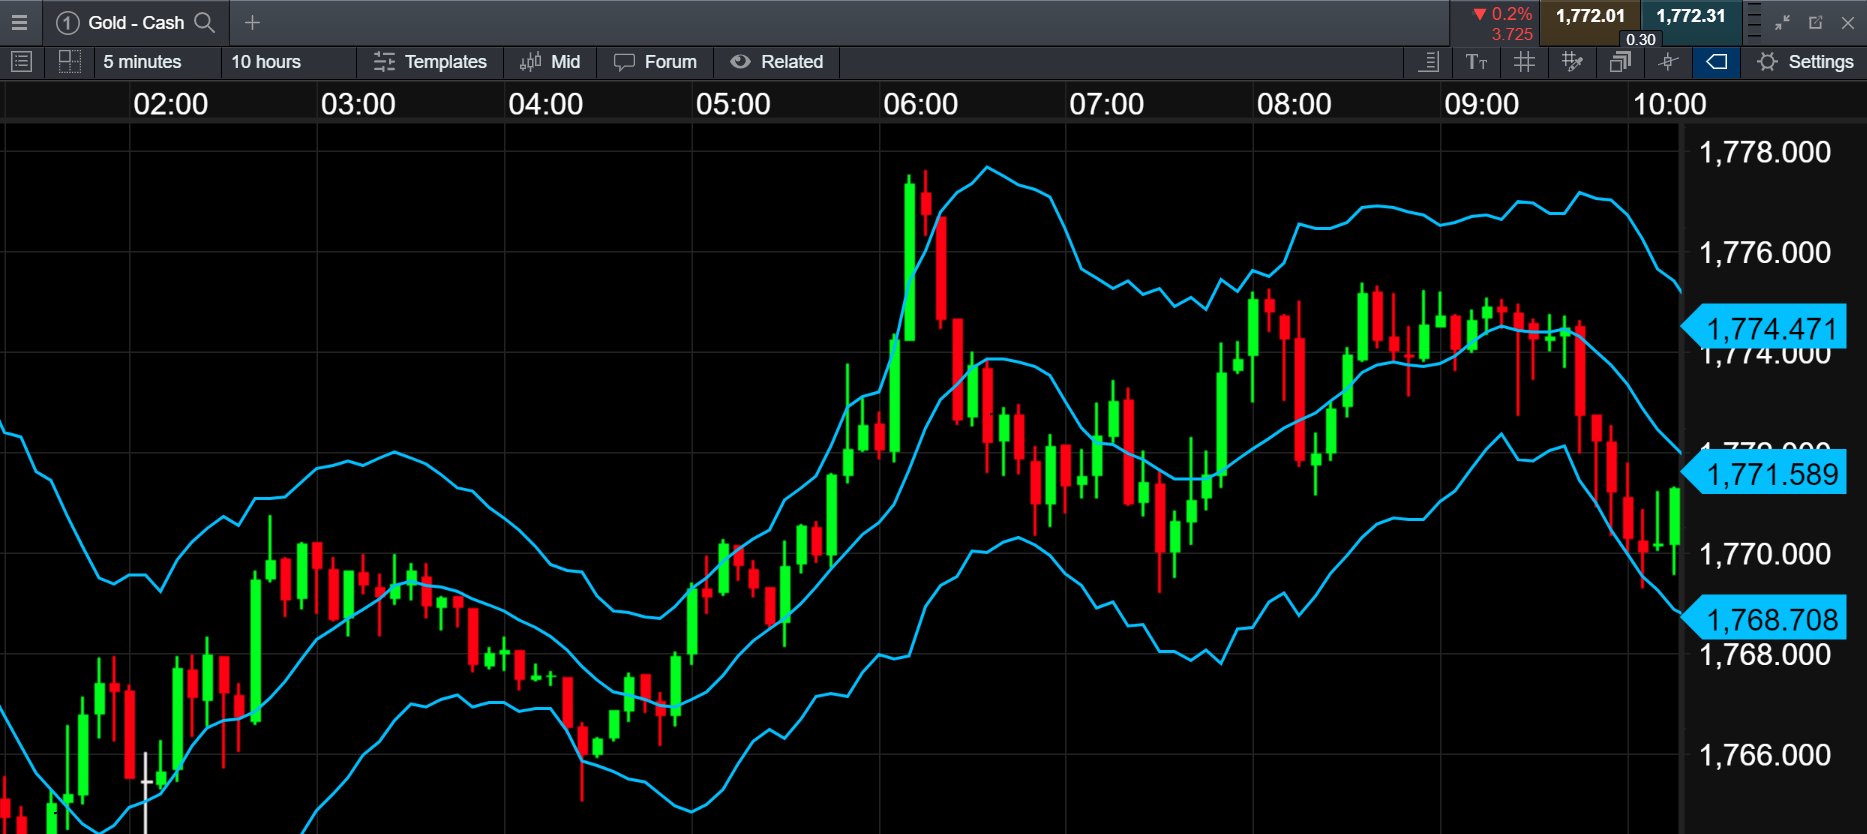
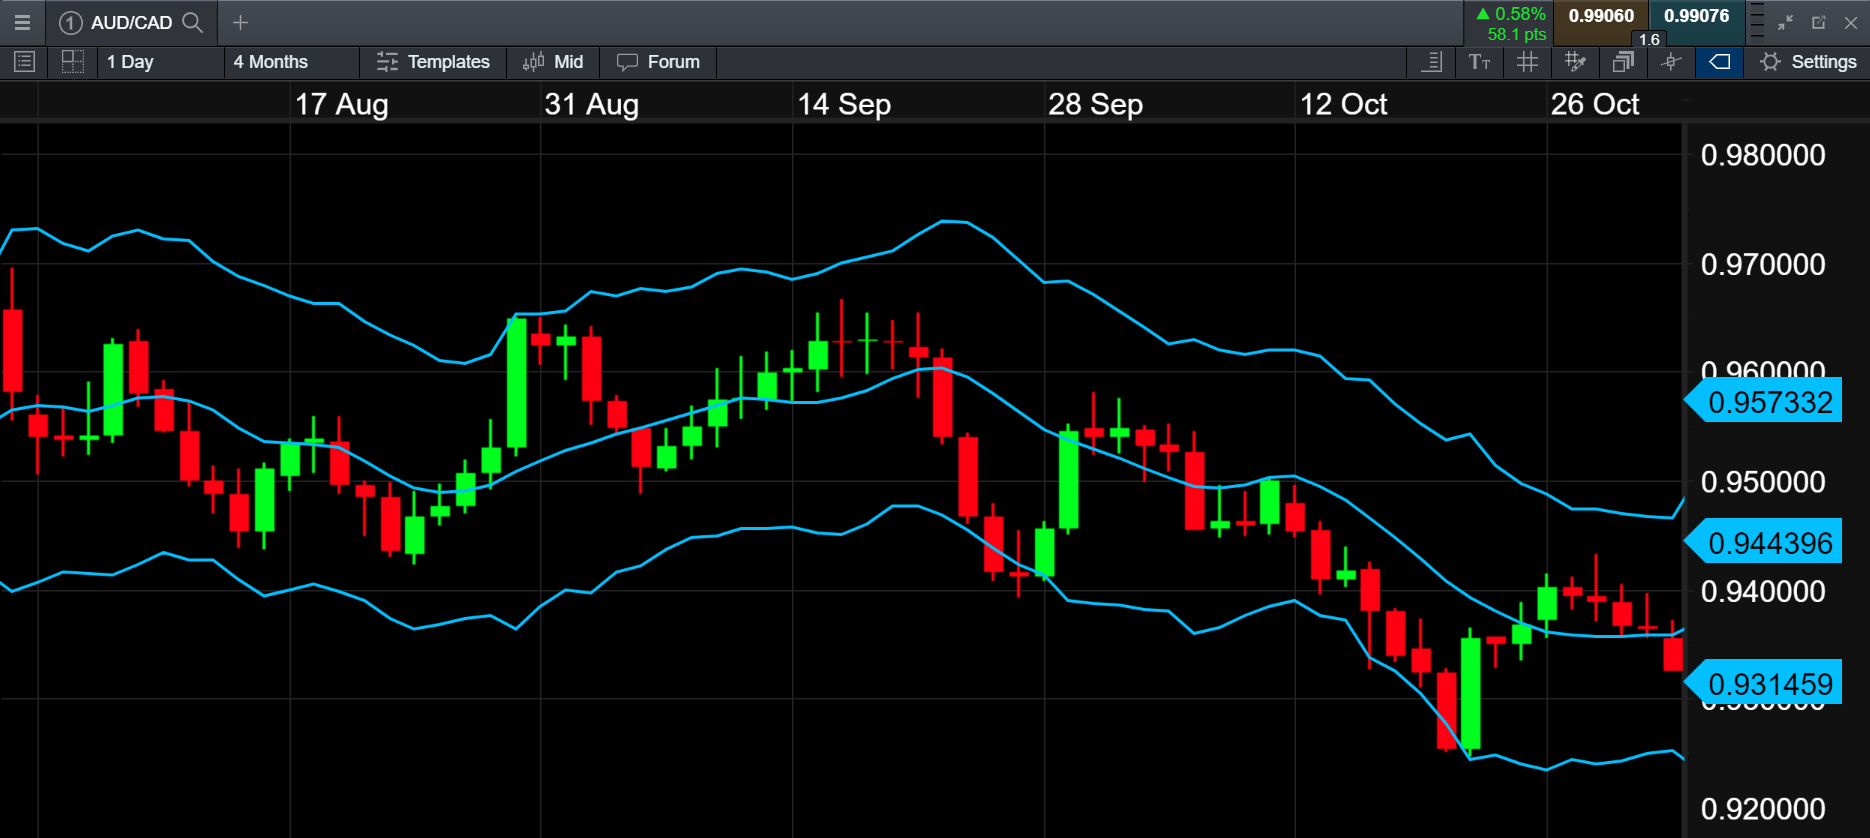
The channels are able to expand and contract depending on the volatility of an asset, although it is not as volatile as other indicators, such as Bollinger Bands. From the image below, we can see that there are three lines with the EMA at the centre. These also help to demonstrate lines of support and resistance for when a trader is planning to enter or exist a position. The price of an asset can fluctuate between the upper and lower bands. The trader may interpret the upper channel as representing resistance and the lower channel representing support. In an uptrend, the price action mostly occurs within the upper channel (as shown in the image for Gold), whereas the price action in a downtrend tends to fall within the lower channel.


