Many traders use technical indicators and charting analysis as an approach to analyse the markets and spot potential trading opportunities and suitable entry and exit points. This article looks at five advanced approaches to technical analysis to help you improve your trading strategy.
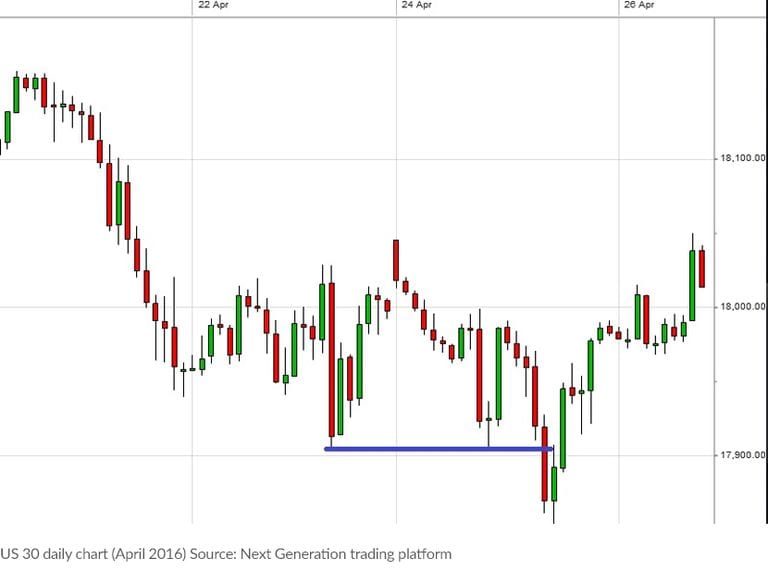
Lots of traders use candlestick charts when looking at price data and it is easy to see why. Candlesticks present the battle between buyers and sellers in a very simple-to-interpret graphical way. Candlestick charts also have their own range of patterns, with many focusing on the psychology of the market and constant battle between buyers and sellers.


