I CFD sono strumenti complessi e presentano un rischio significativo di perdere denaro rapidamente a causa della leva finanziaria. Il 73% di conti di investitori al dettaglio perdono denaro a causa delle negoziazioni in CFD con questo fornitore. Valuta se comprendi il funzionamento dei CFD e se puoi permetterti di correre questo alto rischio di perdere il tuo denaro.

8 essential forex candlestick patterns

Japanese candlesticks, including forex candlestick patterns, are a form of charting analysis used by traders to identify potential trading opportunities based on historical price data. When used in conjunction with other forms of technical and fundamental analysis, Japanese candlesticks can offer valuable insight into possible trend reversals, breakouts and continuations in the markets.

Scopri la nostra piattaforma di trading

Spread competitivi, nessuna commissione nascosta e 12.000 + prodotti

CMC Markets - Handelsplattform


Japanese candlesticks were first invented in Japan in the 18th century and have been used in the western world as a method of analysing the stock markets for well over a century.

Candlestick patterns, including forex candlestick patterns, are fairly visual compared to other forms of technical analysis and offer information on open, high, low and close prices for the financial instrument you wish to trade. Japanese candlesticks are especially useful in offering insight into the short-term price movements of the markets – a valuable tool for day trading strategies.
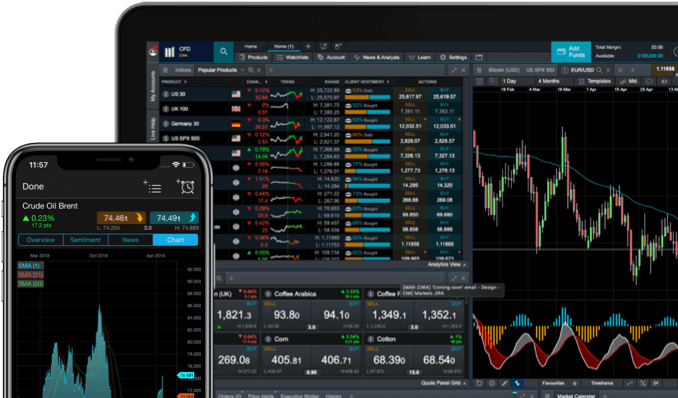
What are candlestick charts?

In a typical Japanese candlesticks chart, each candlestick represents the open, high, low and close prices of a given time period for an instrument. For instance, in a daily candlestick chart for EUR/USD, the wick or shadow at the top of the candlestick would show the highest level prices reached on that day, while the wick or shadow at the bottom of the candlestick would show the lowest level prices reached on that particular day.

The body of the candlestick indicates the difference between the opening and closing prices for the day. A coloured candlestick (usually indicated by black or red) would indicate that the closing price was lower than the opening price, while a candlestick with a transparent body (also usually indicated by white or green) would show that the closing price was higher than the opening price for that day.

8 powerful candlestick patterns

There are over 40 recognised forex candlestick chart patterns in total. We explain eight of the most popular candlestick pattern examples below:

White/Black Marubozu

Black marubozus

Black marubozus are significant candlestick patterns that give valuable insight into selling pressure. Black marubozus are rectangular candlesticks with little or no shadow at the top or bottom. Black marubozus indicate selling pressure in a market and show that bears were calling the shots from the opening bell until the closing bell on the day. Black mazubozus are especially valuable around significant resistance levels and may indicate that a potential price level is about to be hit.

White marubozu

White marubozus are similar to their black counterparts, but indicate that prices are being controlled by buying pressure. White marubozus are rectangular blocks with very little or virtually no shadows at the top or bottom. White marubozus most commonly indicate continuation in an uptrend, while in a downtrend they can indicate that a potential trend reversal could occur.

Doji

Doji, or crosses, are usually made up of a single candlestick and they show that the opening and closing price of a candlestick is virtually the same. Most doji candlesticks resemble crosses or inverted crosses, or plus signs. In technical analysis, dojis usually represent neutrality, meaning that the trend is likely to continue. The shadows, or wicks on a doji are an important indicator of market sentiment. For example, if the shadow at the top of the candlestick is long, it means that investors tried to push the price higher, but failed, while a longer shadow at the bottom indicates the presence of selling pressure.

Engulfing pattern (bullish/bearish)

Engulfing candlestick patterns (bullish/bearish) signify a potential reversal in trend and are indicated by a large candlestick extending higher and lower than (literally engulfing) the previous candlestick. The larger the size of the engulfing candlestick, the more significant it is to analysts. A black engulfing candlestick represents a potential bearish reversal during an uptrend, while a white engulfing candlestick could indicate that a bullish reversal is about to occur in a downtrend.

Trading di CFD con un broker pluripremiato*

Prova il trading di CFD gratuitamente
e senza rischi con il nostro conto demo.

Hammer

A common bullish reversal pattern, hammers indicate that an uptrend is likely to occur. As the name suggests, hammers have a short body, with a shadow or wick that is twice as long at the bottom. When the high and close are the same, it indicates the formation of a bullish candlestick pattern, meaning that while bears tried to push prices lower, buying pressure from the bulls pushed up prices, with prices eventually closing at the same level as the day's high. Hammers where the open is the same as the high are considered less bullish but indicate a possible bullish trend nevertheless.

Shooting star

Shooting stars look a lot like inverted hammers (above) and indicate that a bearish reversal is about to occur. Shooting stars are created when the low, open and close of the day are close to each other, with the day's high located high above, forming atleast twice the length of the body of the candlestick. When the low and closing prices are the same, a shooting star is considered more significant as it indicates that bulls tried to push prices higher but were overpowered by the bears and prices eventually closed at a similar level to where they opened. Can sometimes look like a gravestone doji.

Three-line strike

The three-line strike pattern refers to three white candlesticks occurring on a daily chart three days in a row, indicating that prices closed higher for three simultaneous days. Three-line strikes usually occur at the end of a downtrend and may, therefore, indicate that a reversal might be in order.

Three black crows

Three-black crows are a common reversal indicator in an uptrend and are indicated by three black consecutive candlesticks on a daily chart where the closing prices were lower than the opening price of the day. Formed of three consecutive black candlesticks with long bodies, these indicate the lack of buying conviction in the market which allowed bears to successfully push prices lower.

Evening star

Evening star patterns usually occur at the top of an uptrend and signify that a trend reversal is about to occur. Evening stars consist of three candlesticks, with the first candlestick having a significantly large green or white body, indicating that prices closed higher than the opening level. The second candlestick opens higher after a gap, meaning that there is continued buying pressure in the market. The second candlestick in an evening star pattern is usually small, with prices closing lower than the opening level. The third and final candlestick in an evening star opens lower after a gap and signifies that selling pressure reversed gains from the first day's opening levels.

Summary

When used in conjunction with other forms of analysis, candlestick patterns can be a useful indicator of potential trend reversals and price breakouts in the market, helping you to build a stronger and more effective trading strategy.

CMC Markets è un fornitore di servizi di sola esecuzione. Queste informazioni (che contengano o meno opinioni) hanno solo scopo informativo e non tengono conto delle circostanze o degli obiettivi personali dell'utente. Nessuna delle informazioni contenute in questo documento è (o dovrebbe essere considerata) una consulenza finanziaria, di investimento o di altro tipo su cui si può fare affidamento. Nulla nei documenti costituisce una raccomandazione da parte di CMC Markets o dell'autore secondo cui un particolare investimento, titolo, transazione o strategia d'investimento sia adatto a una particolare persona. I materiali non sono stati preparati in conformità con i requisiti di legge volti a promuovere l'indipendenza della ricerca di mercato degli investimenti. Sebbene non sia espressamente vietato a noi trattare prima di fornire questo materiale, non cerchiamo di trarne profitto prima della sua diffusione.


Fai trading di CFD con CMC Markets in 3 passi

1

Invia richiesta

Completa il nostro semplice modulo di candidatura conto.

2

Deposita

Finanzia il tuo conto tramite bonifico bancario, carta di credito o PayPal.

3

Fai trading

Dopo aver finanziato il tuo conto, puoi iniziare subito a fare trading.

Hello, we noticed that you’re in the UK.

The content on this page is not intended for UK customers. Please visit our UK website.

Go to UK site

Prima di partire...

Prova il trading di CFD sulla nostra innovativa piattaforma con un conto demo. Gratis e senza rischi con un capitale virtuale a partire da 10.000€.

cmc-mobile-trading-app