The US economy remains strong and inflation remains hot. This has led to rates rising rapidly, strengthening the dollar. This week brings a fresh round of economic data, with ISM manufacturing and services index readings set to give investors their first glimpse of how the US economy performed in February.
The Institute for Supply Management’s manufacturing index is forecast to have risen to 48 in February, up from 47.4 in January. The service index is expected to have fallen to 54.5, down from 55.2. A number above 50 indicates that a sector is expanding, while a number below 50 indicates contraction. Within the two reports, investors are likely to focus on the prices paid indexes, as they can show previews of inflationary impulses in February.
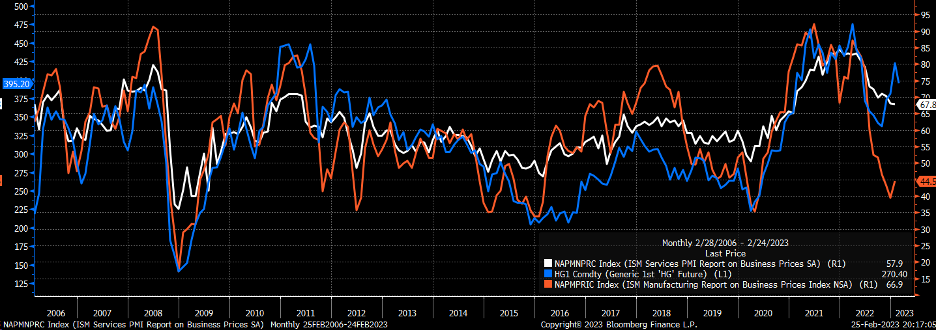
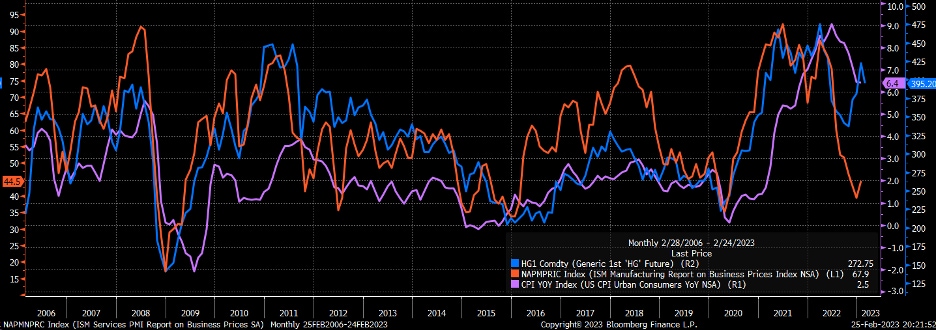
Historically, commodities like copper have been highly correlated to the prices paid indexes for both services and manufacturing. The recent surge in copper suggests where prices may be heading for both indexes. Clearly, that would send a negative signal to investors because these indexes are also closely tied to the consumer price index (CPI) on a year-on-year basis. If the ISM prices paid indexes increase, it could suggest that CPI in February might come in hot when the figure is announced in March.
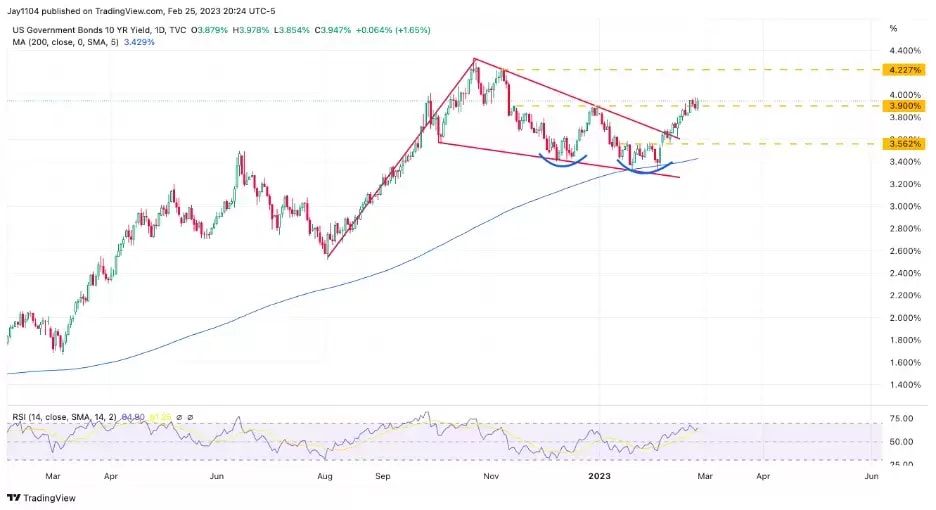
10-year Treasury on the rise
Hotter prices paid indexes are likely to push rates even higher, which is what the 10-year Treasury technical charts already suggest. Recently, the 10-year broke out of a bull pennant and appeared to form a double-bottom pattern. The bullish patterns indicate that the 10-year could continue to rise to 4.25%, testing its previous highs.
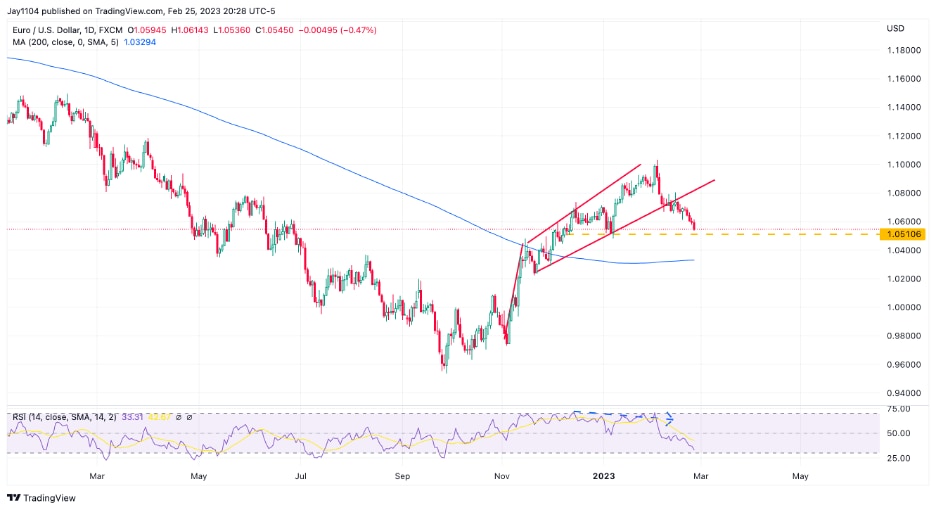
Euro down against the dollar
It took a while, but the euro finally broke down against the dollar, falling out of that rising megaphone and demonstrating a bearish pattern. Now the euro can find some meaningful support against the dollar at $1.05. However, a break of support could send the euro lower and back to the 200-day moving average.
S&P 500 slides
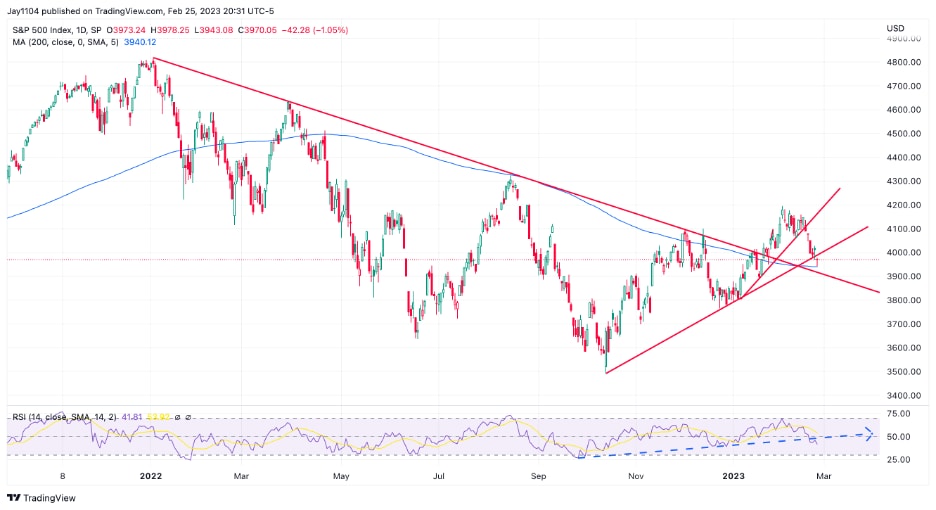
The S&P 500 also broke an uptrend off the October lows by gapping under it, a very bearish signal. The 3,900 and 3,950 range may offer the index plenty of support, due to the 200-day moving average, along with a long-term downtrend, which served as resistance and now becomes support.
However, a break of those two key levels suggests that a further decline back to 3,800 may be possible. Additionally, the relative strength index (RSI) has fallen below an uptrend, suggesting a change in momentum from bullish to bearish for the S&P 500.
Dow dips
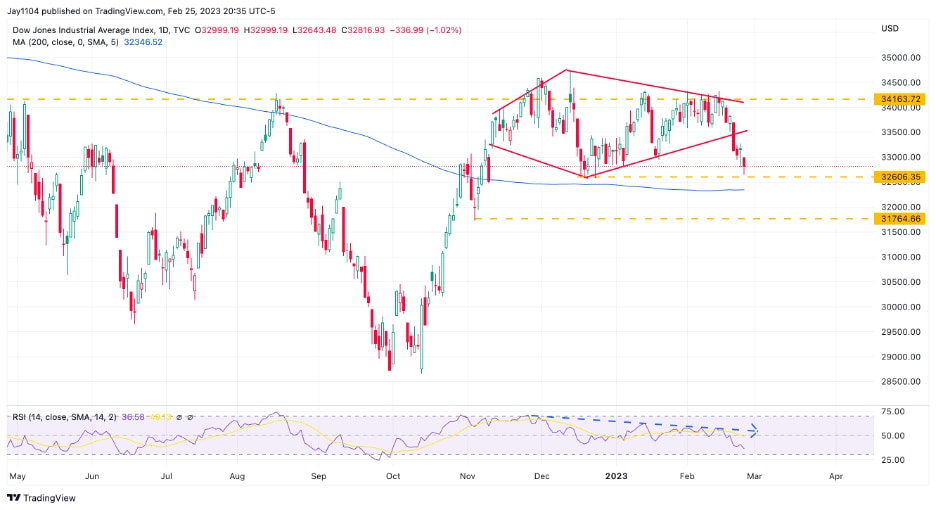
The Dow Jones Industrial Average has also finally fallen out of its diamond reversal pattern. For now, there is support at 32,600. However, the RSI suggests the trend is still lower. Additionally, if the pattern was indeed a diamond, there should be further for the average to fall, potentially to 31,800. Ultimately, the Dow Jones may decline back towards the October lows of 28,800.
Nasdaq 100 also down
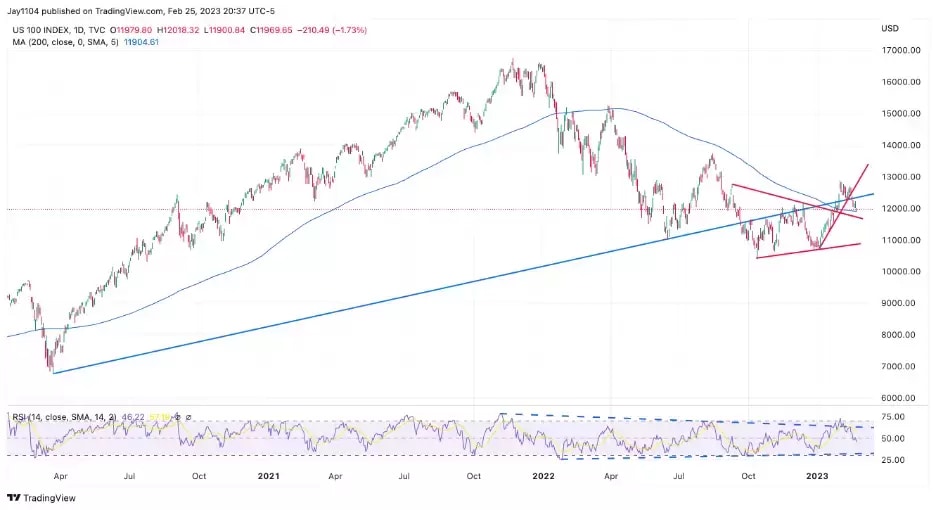
It is not much different for the Nasdaq 100, with support between 11,700 and the 200-day moving average. However, a failure to hold support could lead the index to fall back to the lows of last year. The RSI is bearish and trending lower, suggesting lower prices to come. Additionally, the Nasdaq is again below the uptrend that formed off the March 2020 lows.
If inflation remains hot and the economy stays strong, then financial conditions will have to tighten. That is likely to mean rising yields, a strengthening dollar, and lower stock prices. That was the theme of 2022, and it isn't likely to change in 2023 unless the economic data changes.
If the economic data in February comes in like the data in January, then rates and the dollar have much further to rise, and US equity markets will have to adjust to much lower levels, if not new lows.
Charts used with the permission of Bloomberg Finance LP. This report contains independent commentary to be used for informational and educational purposes only. Michael Kramer is a member and investment adviser representative with Mott Capital Management. Mr. Kramer is not affiliated with this company and does not serve on the board of any related company that issued this stock. All opinions and analyses presented by Michael Kramer in this analysis or market report are solely Michael Kramer's views. Readers should not treat any opinion, viewpoint, or prediction expressed by Michael Kramer as a specific solicitation or recommendation to buy or sell a particular security or follow a particular strategy. Michael Kramer's analyses are based upon information and independent research that he considers reliable, but neither Michael Kramer nor Mott Capital Management guarantees its completeness or accuracy, and it should not be relied upon as such. Michael Kramer is not under any obligation to update or correct any information presented in his analyses. Mr. Kramer's statements, guidance, and opinions are subject to change without notice. Past performance is not indicative of future results. Past performance of an index is not an indication or guarantee of future results. It is not possible to invest directly in an index. Exposure to an asset class represented by an index may be available through investable instruments based on that index. Neither Michael Kramer nor Mott Capital Management guarantees any specific outcome or profit. You should be aware of the real risk of loss in following any strategy or investment commentary presented in this analysis. Strategies or investments discussed may fluctuate in price or value. Investments or strategies mentioned in this analysis may not be suitable for you. This material does not consider your particular investment objectives, financial situation, or needs and is not intended as a recommendation appropriate for you. You must make an independent decision regarding investments or strategies in this analysis. Upon request, the advisor will provide a list of all recommendations made during the past twelve months. Before acting on information in this analysis, you should consider whether it is suitable for your circumstances and strongly consider seeking advice from your own financial or investment adviser to determine the suitability of any investment. Michael Kramer and Mott Capital have received compensation for this article.
Disclaimer: CMC Markets is an order execution-only service. The material (whether or not it states any opinions) is for general information purposes only, and does not take into account your personal circumstances or objectives. Nothing in this material is (or should be considered to be) financial, investment or other advice on which reliance should be placed. No opinion given in the material constitutes a recommendation by CMC Markets or the author that any particular investment, security, transaction or investment strategy is suitable for any specific person. The material has not been prepared in accordance with legal requirements designed to promote the independence of investment research. Although we are not specifically prevented from dealing before providing this material, we do not seek to take advantage of the material prior to its dissemination.


