The daily chart below, screen-grabbed yesterday, shows the iShares 20+ Year Treasury Bond ETF (TLT) dropping to a new low, underperforming the S&P 500 (SPY). That’s the bad news.
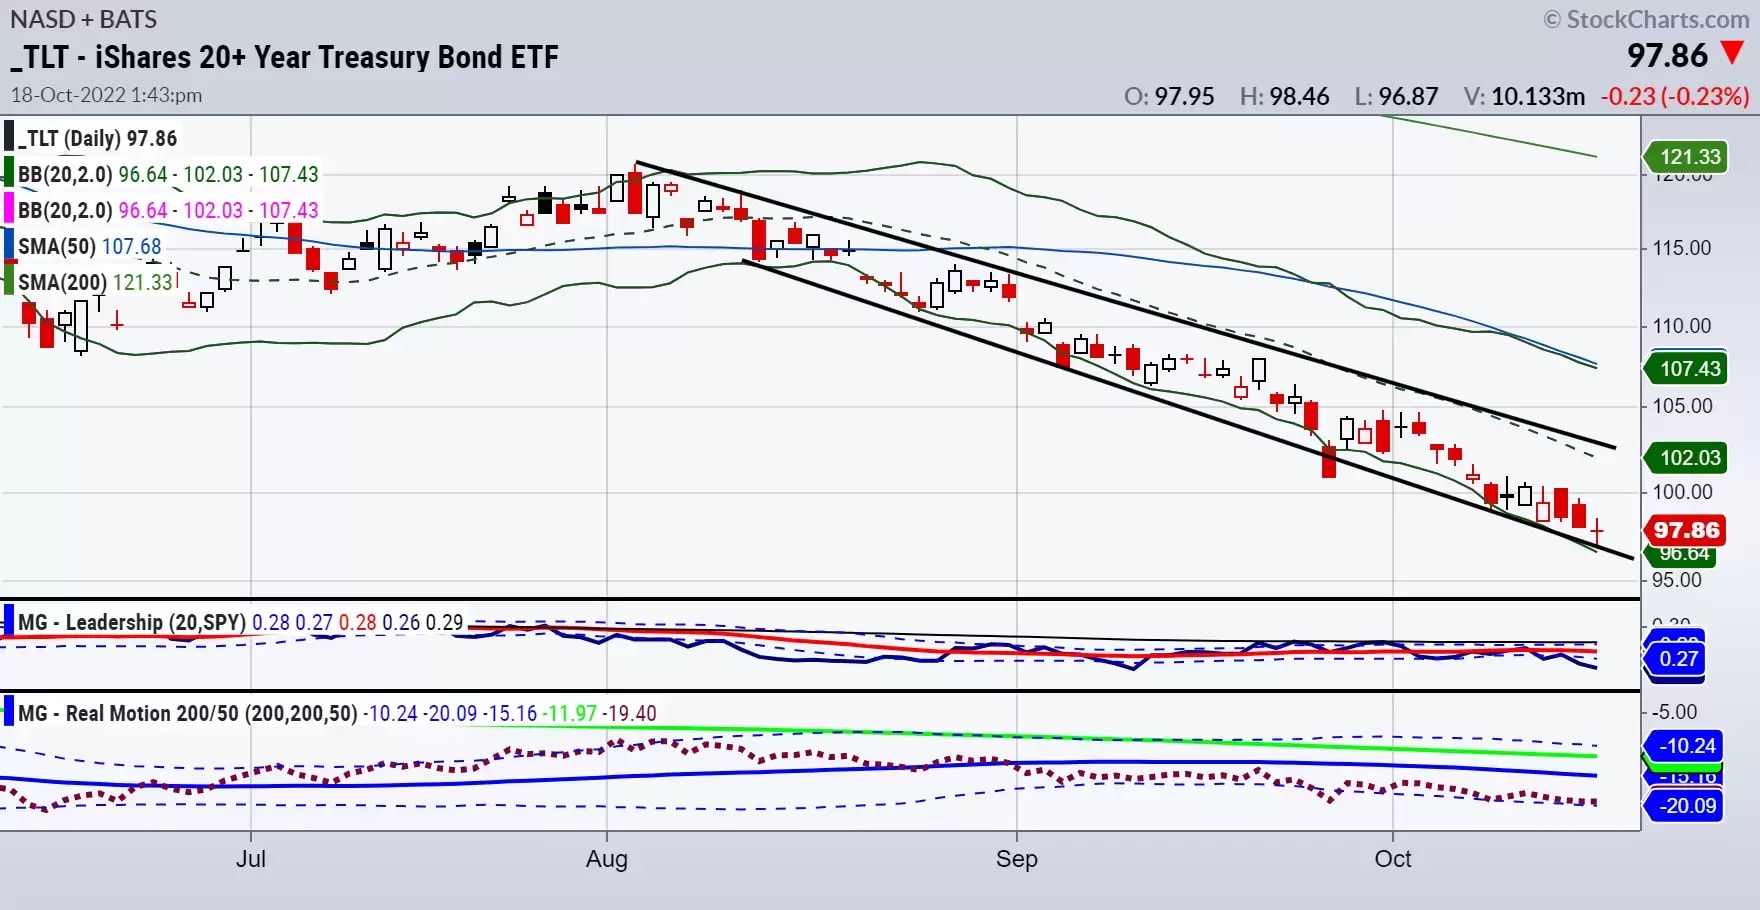
The good news is threefold:
1. The bottom trendline is holding, the 27 September low notwithstanding. This gives us a great risk point. If Tuesday’s low holds, and we’re buying the instrument itself, at least we know where we are wrong.
2. Corresponding to the lower trendline is the Bollinger Band (we use a 20-day period and two standard deviations).
3. The Real Motion indicator, although weak in momentum, remains above the low of 27 September. That could be significant.
The monthly chart below, which stretches back to 2014, shows TLT at a multi-year low. Our conclusion? TLT is historically oversold.
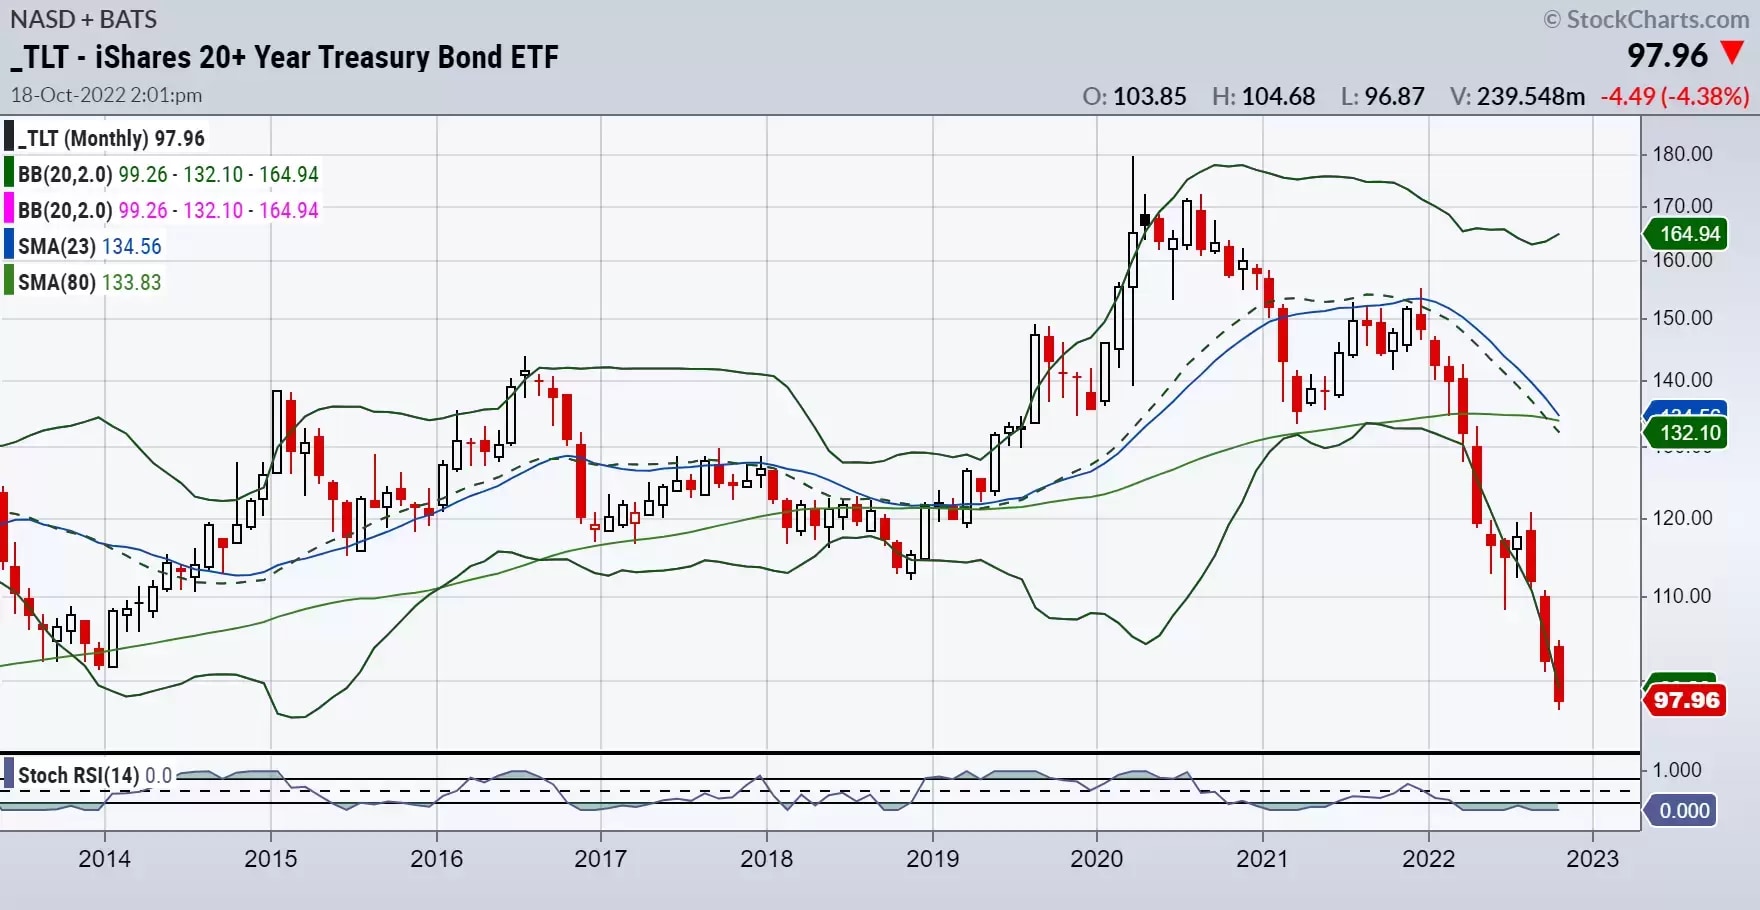
Should TLT rise back above $100, we would take that as a good start. If it clears the upper trendline, we would take that as a precursor to a potential US Federal Reserve pivot on interest rates.
S&P 500 up more than 3% this week
The S&P 500 ETF (SPY) had a bullish engulfing candle pattern last Thursday (13 October), as illustrated in the chart below. Friday’s price action was not as clean as we would have liked, with SPY closing the week below Thursday’s high.
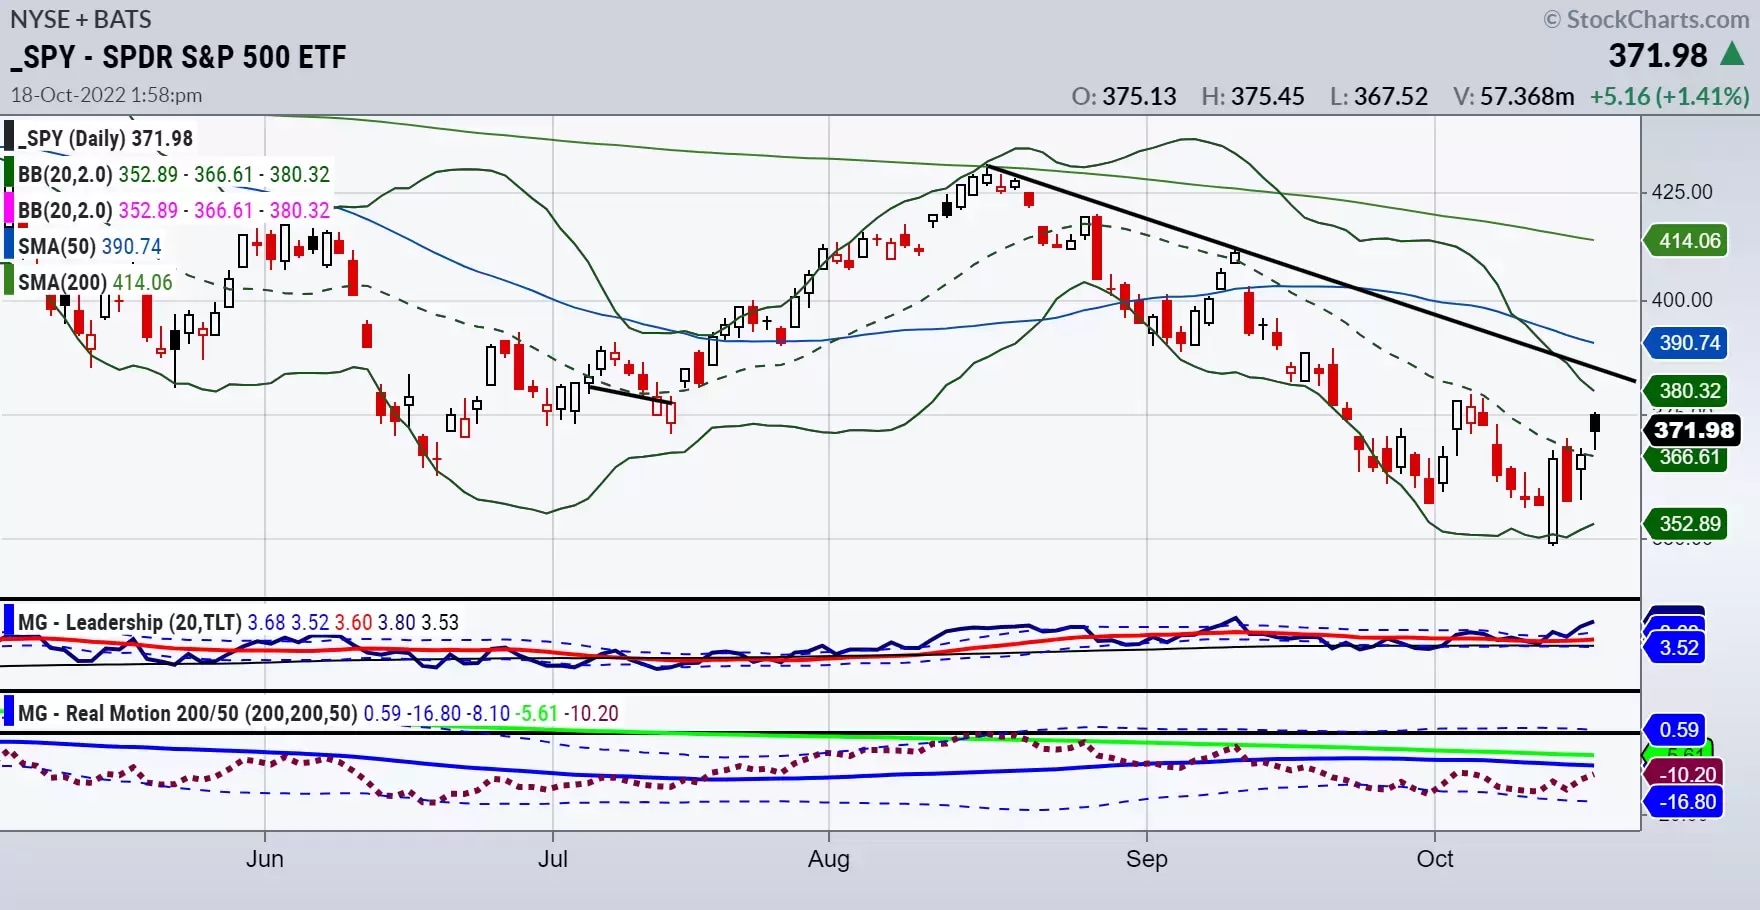
On Monday the SPY had an inside day candle, also known as a harami pattern, meaning that it traded within the previous trading day’s high-low range. That pregnant pause gave birth to a rally on Tuesday, although ultimately SPY could not take out overhead resistance. Resistance at $380 now appears key, with pivotal support at $360.
The Real Motion indicator mirrors the resistance levels as momentum has risen, but not by enough to clear the 50-day and 200-day moving averages.
The chart has one bright spot, which also presents a conundrum. On the one hand, we want to see SPY outperforming TLT as that would indicate that money is entering the market despite higher yields. On the other hand, we want to see TLT stop the bleed, since yields above current levels would put more pressure on the market.
Mish’s ETF support and resistance levels
S&P 500 (SPY) to hold 360 and clear 380
Russell 2000 (IWM) to clear 178.50, with 170 now pivotal support
Dow (DIA) to hold 299
Nasdaq (QQQ) to take out and hold over 274
Regional banks (KRE) sits right on support at 63.00, needs to clear 66.00
Semiconductors (SMH) is a weak link; needs to hold 175 and get back over 184
Transportation (IYT) cleared 207, 200-WMA is at 215
Biotechnology (IBB) could push through 125 to get to 130, provided that 121 holds
Retail (XRT) weekly chart resistance at 62, long-term support at 55
Mish Schneider is MarketGauge’s director of trading education and research. Read more of MarketGauge’ s market analysis here, and subscribe to their YouTube channel here. Mish Schneider's and MarketGauge's views and findings are their own, and should not be relied upon as the basis of a trading or investment decision. Pricing is indicative. Past performance is not a reliable indicator of future results.
Disclaimer: CMC Markets is an execution-only service provider. The material (whether or not it states any opinions) is for general information purposes only, and does not take into account your personal circumstances or objectives. Nothing in this material is (or should be considered to be) financial, investment or other advice on which reliance should be placed. No opinion given in the material constitutes a recommendation by CMC Markets or the author that any particular investment, security, transaction or investment strategy is suitable for any specific person. The material has not been prepared in accordance with legal requirements designed to promote the independence of investment research. Although we are not specifically prevented from dealing before providing this material, we do not seek to take advantage of the material prior to its dissemination.


