US oil benchmark West Texas Intermediate (WTI) and gold both rose higher than we expected in our late February forecasts, causing us to revise our wave counts on daily and intraday time frames. Of the two commodities, WTI has followed our expectations more closely. We are still waiting for gold to turn downward.
Could WTI dip to $57.70?
On 6 March WTI posted a slightly higher high compared to 13 February. That led us to reposition the wave [II] label as shown on the chart below. After the high was set, price began declining strongly in the anticipated wave [III], which probably hasn't finished yet.
Based on the internal wave structures, we believe the market is currently working through the late stages of upward/sideways sub-wave (IV) of [III], to be followed by downward sub-wave (V). Similarly we think the next order of fractal has yet to produce its own waves [IV] and [V].
Readers who trade on daily and intraday time frames may find potential trading opportunities in both directions during the next two or three weeks as the nested fractal patterns play out. As indicated on the weekly inset, below, our preferred support targets for the final wave [ii] low wait near $57.70 a barrel and $50.85, with $46.88 a stretch target.
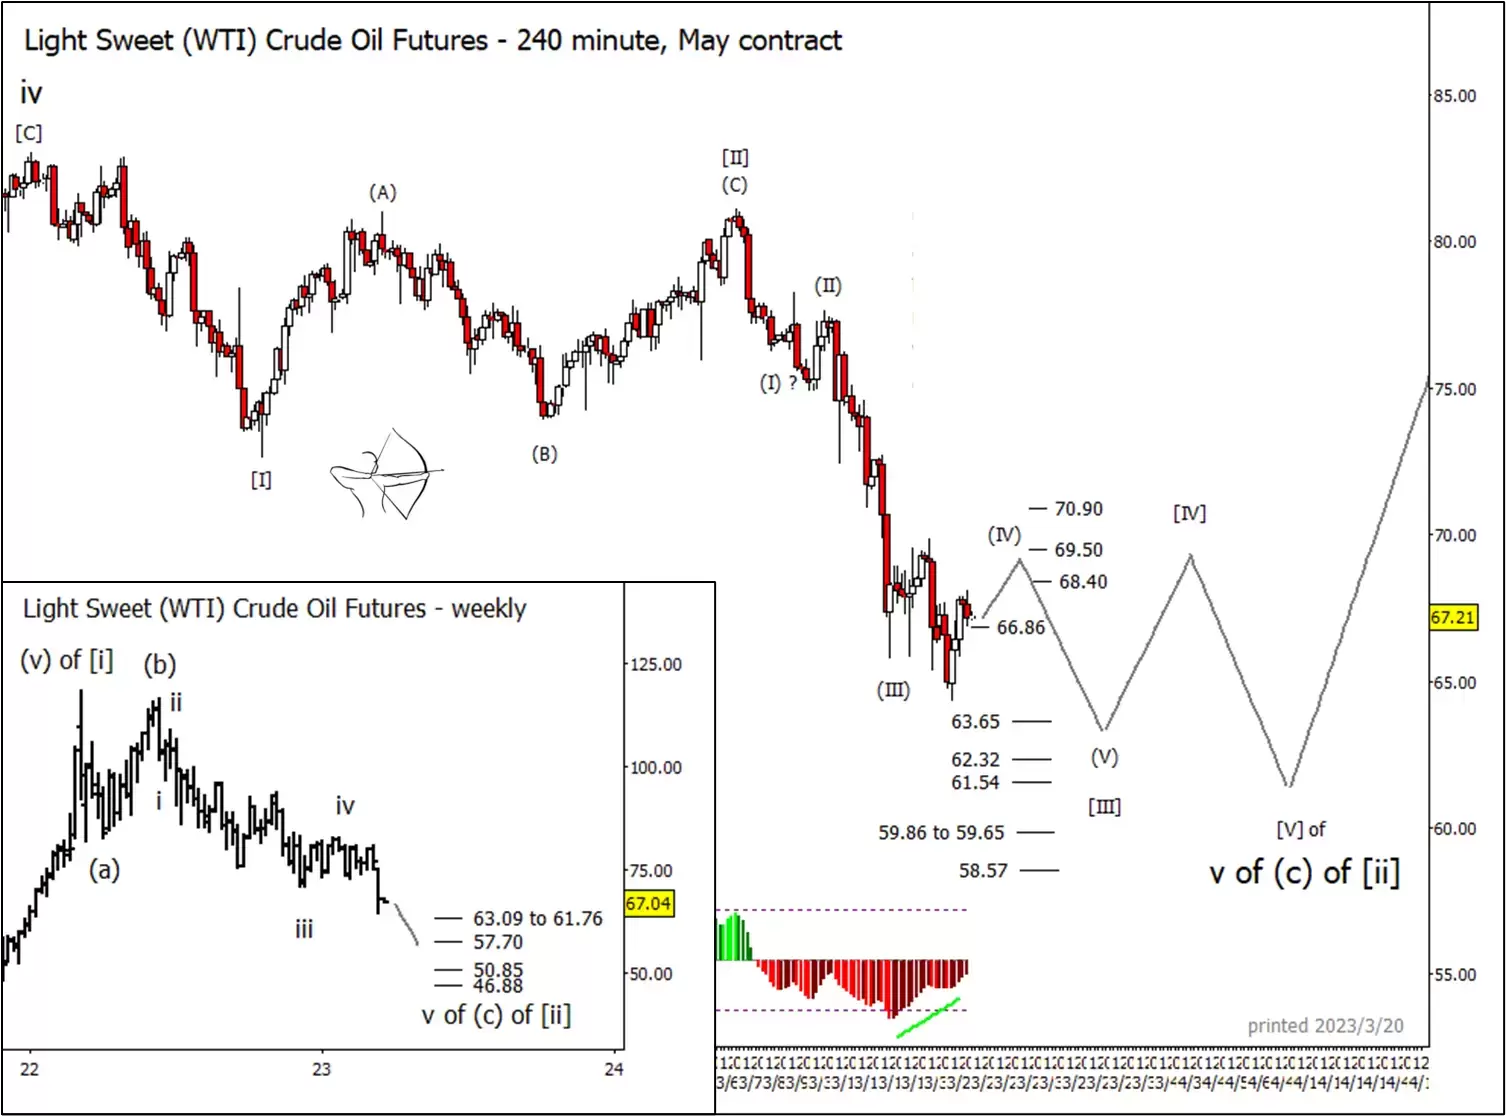
On the 240-minute WTI chart, the adaptive Commodity Channel Index (CCI) – a momentum indicator that helps determine when a commodity is reaching overbought or oversold levels – showed a positive divergence ahead of the current bounce. The divergence is internal to sub-wave (IV), but probably doesn't mark the final low of the sequence.
We would not usually consider an entire five-wave downward structure to be complete until the indicator has tested the zero line at least once from below or has spent some time with green bars above the zero line. Our expectation would be similar for wave [IV] and the momentum indicator on a daily chart.
Gold to slump after unexpected rally?
Gold has climbed considerably higher than we expected in recent weeks. Moreover, the structure up from the November low is ambiguous. Our preferred scenario treats the pattern as a corrective wave (iv), as shown by the wave count with black labels in the monthly inset below. Alternatively, it could also be counted as an upward impulsive wave (i), as shown by the blue labels. Both scenarios call for price to turn downwards soon, but the alternative path could see price put in a higher low compared to 2022.
Cycles suggest that the next low might occur around June or July. Tentatively, support near $1,787 per ounce marks the area to watch if price is to make a higher low. Our preferred target zone for a lower low is from $1,550 to $1,524. The decline should consist of three sub-waves, regardless of which scenario is operating.
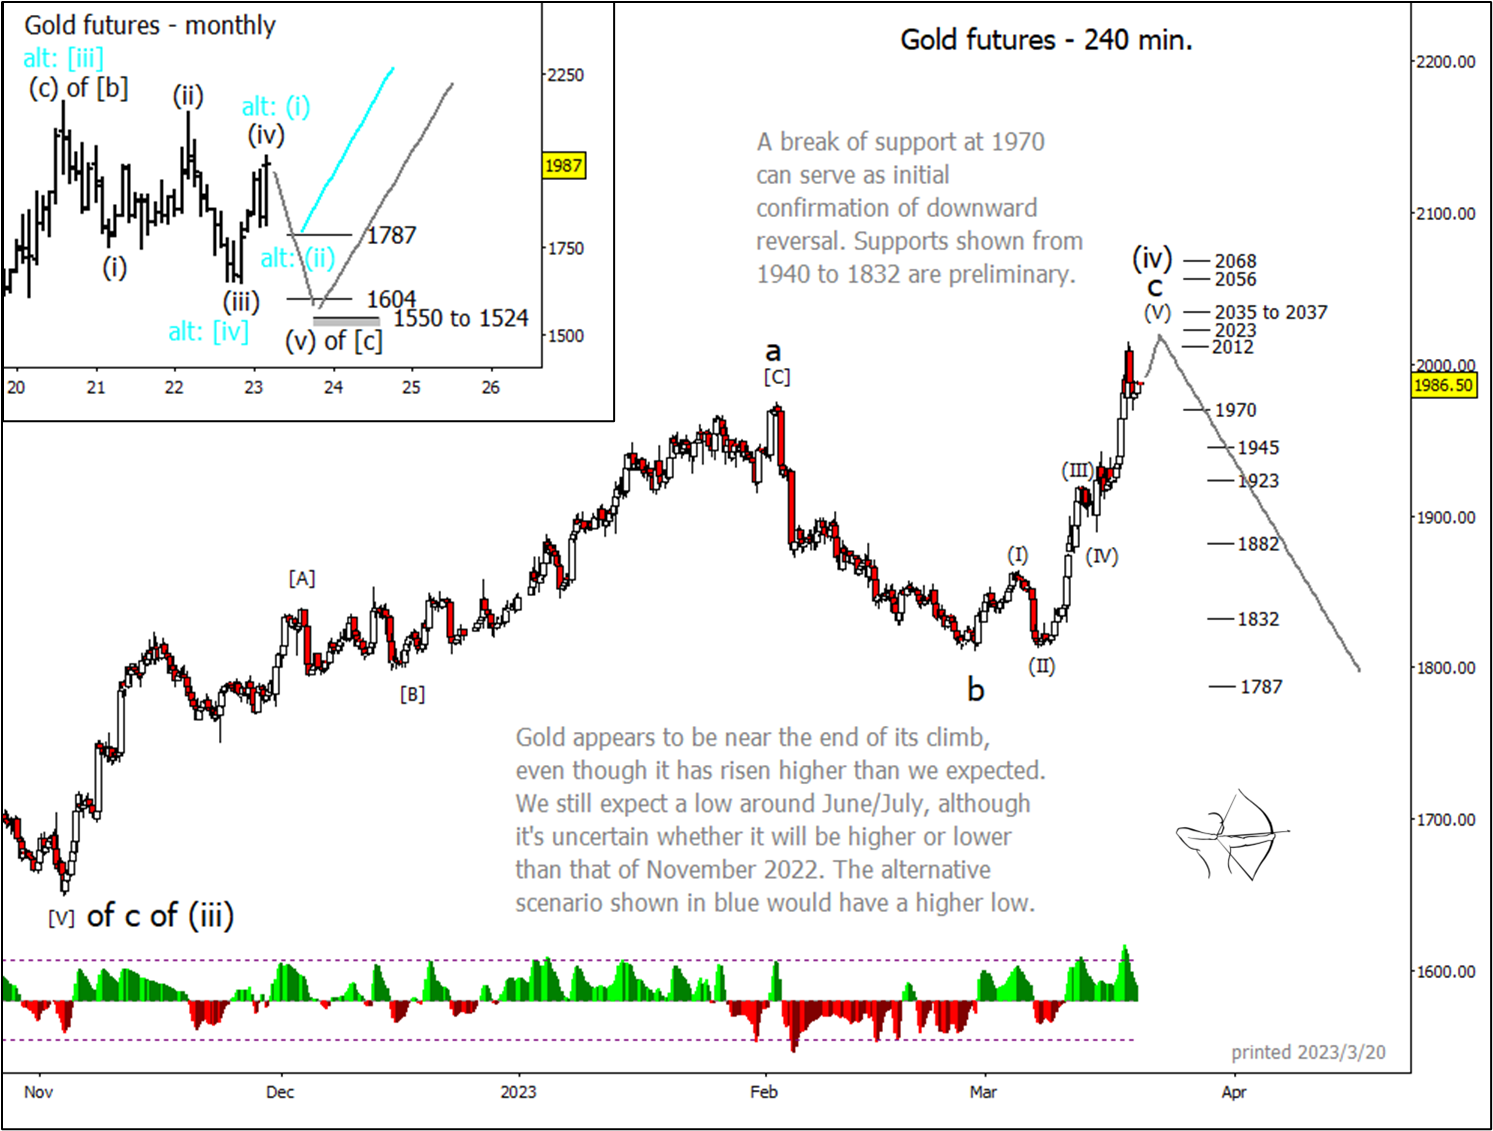
In the very near term, gold might reach a little higher to test the resistance levels marked from $2,023 to $2,037, or even the area near $2,056 and $2,068. A break and daily close below $1,970 can serve as initial confirmation of a downward reversal.
For more technical analysis from Trading On The Mark, follow them on Twitter. Trading On The Mark's views and findings are their own, and should not be relied upon as the basis of a trading or investment decision. Pricing is indicative. Past performance is not a reliable indicator of future results.
Disclaimer: CMC Markets is an execution-only service provider. The material (whether or not it states any opinions) is for general information purposes only, and does not take into account your personal circumstances or objectives. Nothing in this material is (or should be considered to be) financial, investment or other advice on which reliance should be placed. No opinion given in the material constitutes a recommendation by CMC Markets or the author that any particular investment, security, transaction or investment strategy is suitable for any specific person. The material has not been prepared in accordance with legal requirements designed to promote the independence of investment research. Although we are not specifically prevented from dealing before providing this material, we do not seek to take advantage of the material prior to its dissemination.


