An important lesson I learned during my 13 years trading on the New York commodities exchange floor is that once commodities wake up, expect volatility. Furthermore, the bullish cycle in commodities that emerged in 2020 could take years to abate.
The relationship between the US dollar and the Bloomberg Commodity Spot Index is fascinating. The latter, represented by the orange line on the chart below, reached a post-Covid peak in May. The US Dollar Index – the blue line – peaked in September.
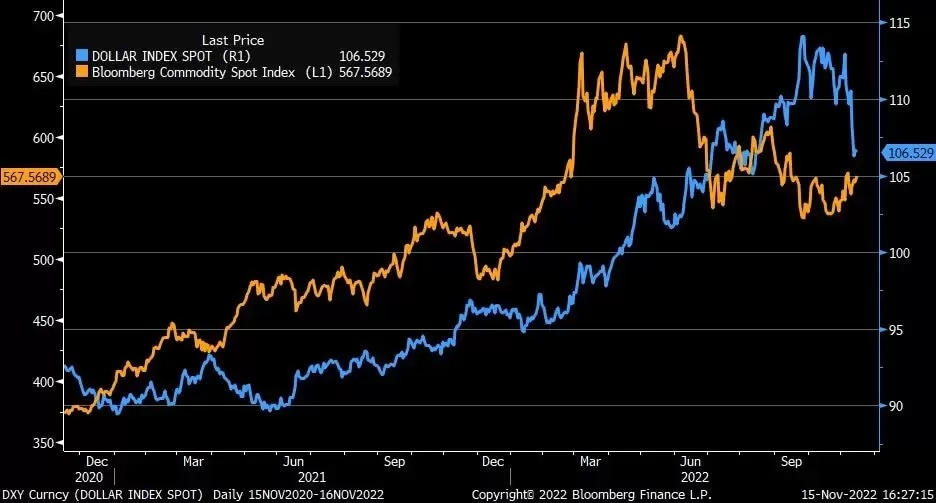
Now, as the dollar declines from its peak, the commodity spot index has found support and looks like it could soon confirm a new move higher.
Gold on the up
The gold chart below offers evidence of the volatility that can occur once commodities begin to stir. While the S&P 500 (SPY) peaked in January 2022, the SPDR Gold Shares (GLD) fund consolidated. GLD then increased until interest rates and the US dollar moved higher. That nasty topping candle in early March stands as a beacon of warning to many gold bulls.
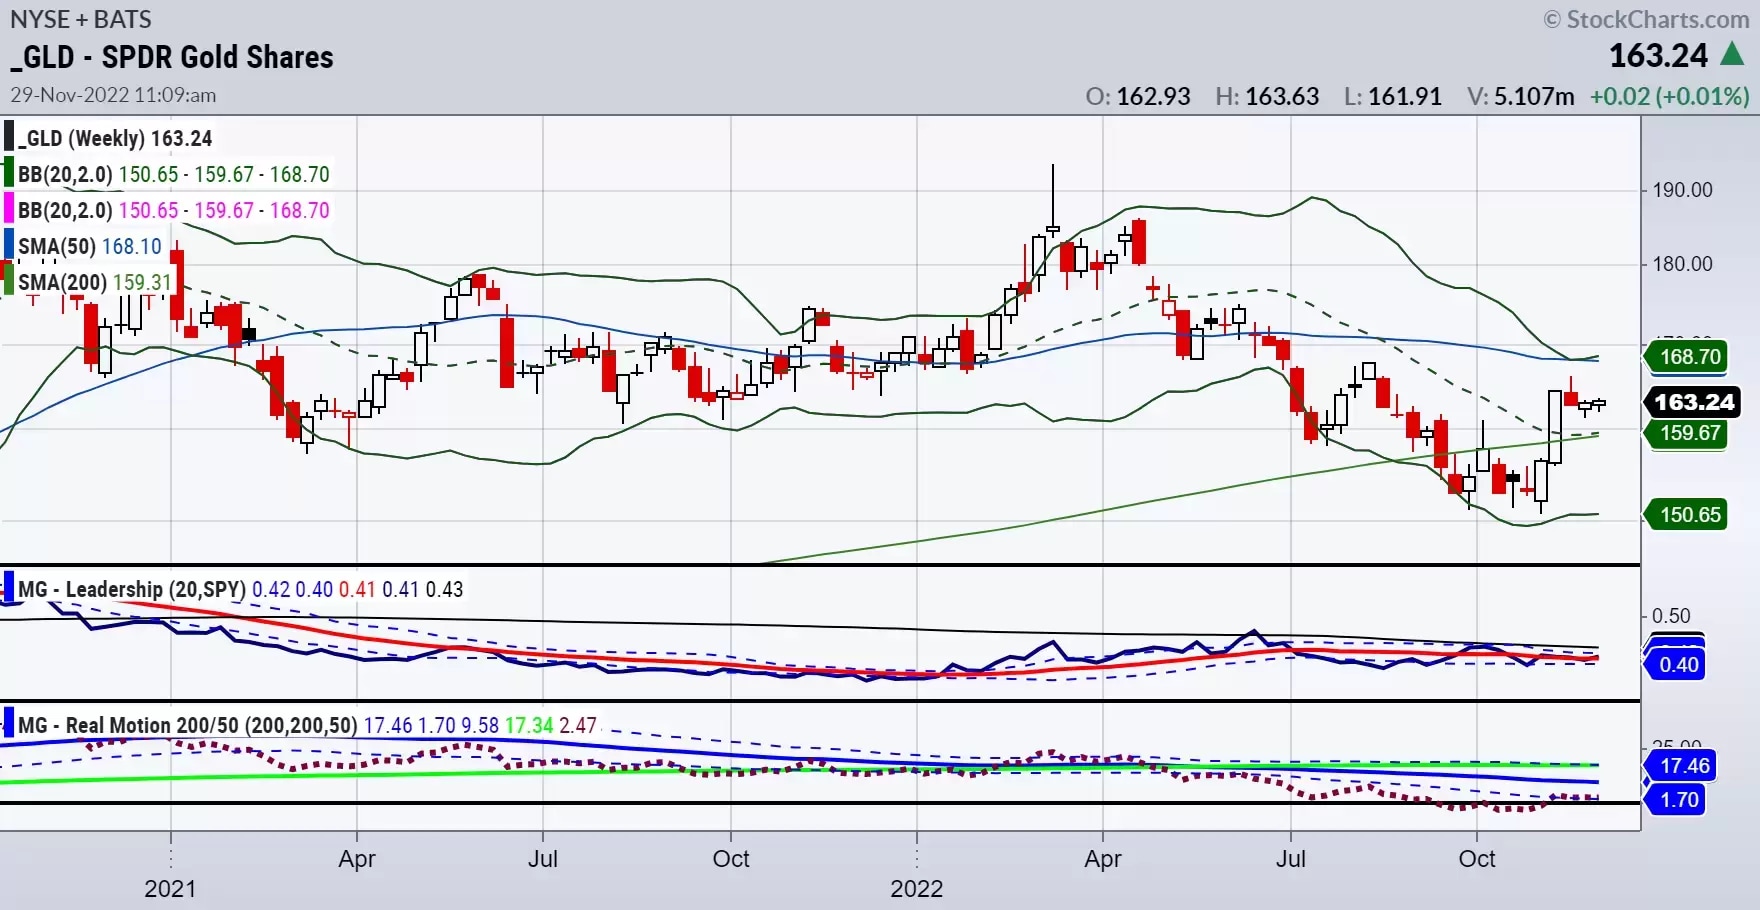
After the ensuing sell-off, and against the backdrop of a weaker dollar, gold is back above its 2022 low and consolidating again.
On Tuesday, US gold futures settled 0.5% higher at $1,748.4 per ounce. The yellow metal could eventually clear $1,780 and head towards $2,000.
The weekly chart, above, shows that GLD is outperforming the benchmark, according to our Leadership Indicator. The Real Motion momentum indicator shows a current mean reversion trade. Essentially, 159-160 is the support to hold.
Aluminium producer finds support
Aluminium is down roughly 40% from the record high of approximately $4,000 that it touched in March amid fears of a global recession. Currently, aluminium futures are trading at around $2,380.
If you do not trade futures, another way to track the price of aluminium is through Alcoa Corp (AA), the largest US aluminium producer.
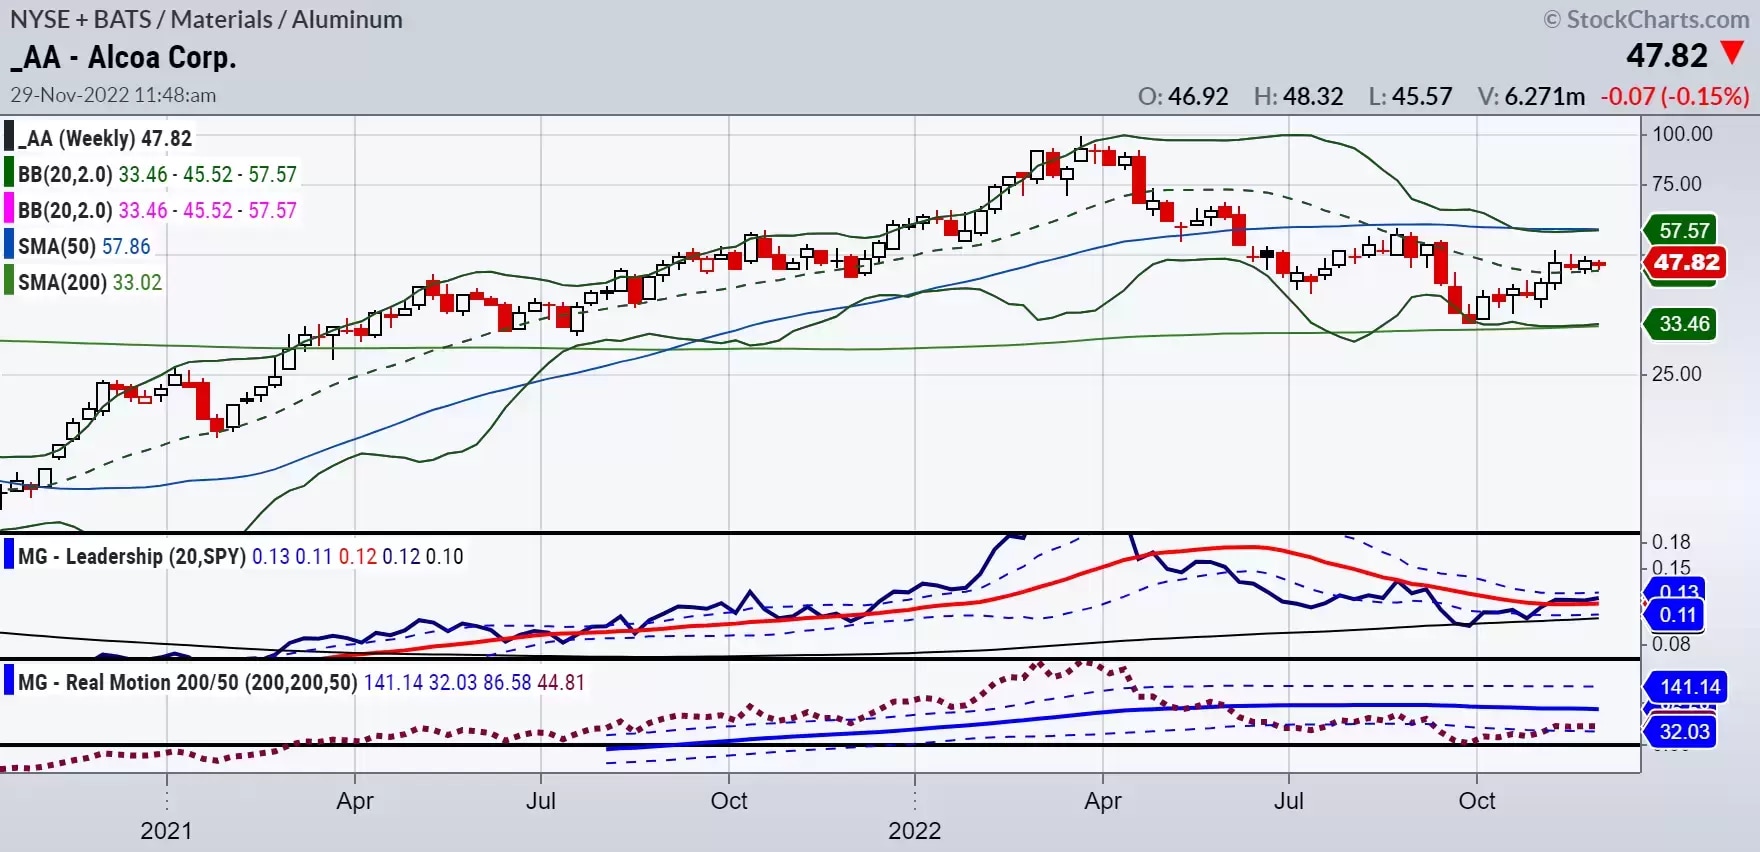
AA has been outperforming the SPY recently. Momentum is basically sideways. The share price deserves some attention, with $45 a good support level to watch as a risk point. If the stock climbs to $50, it could rise to the first big resistance level at $58.
Soybeans could jump
Soybeans are another commodity to keep on your radar. In Brazil, the world's largest exporter of soybeans, short-term crop stress due to dry conditions is expected to affect up to a third of soybean-growing areas.
Soybean futures are trading at around $14.60 per contract ahead of the US Department of Agriculture’s (USDA) latest weekly report, which is set to be published this afternoon in the US.
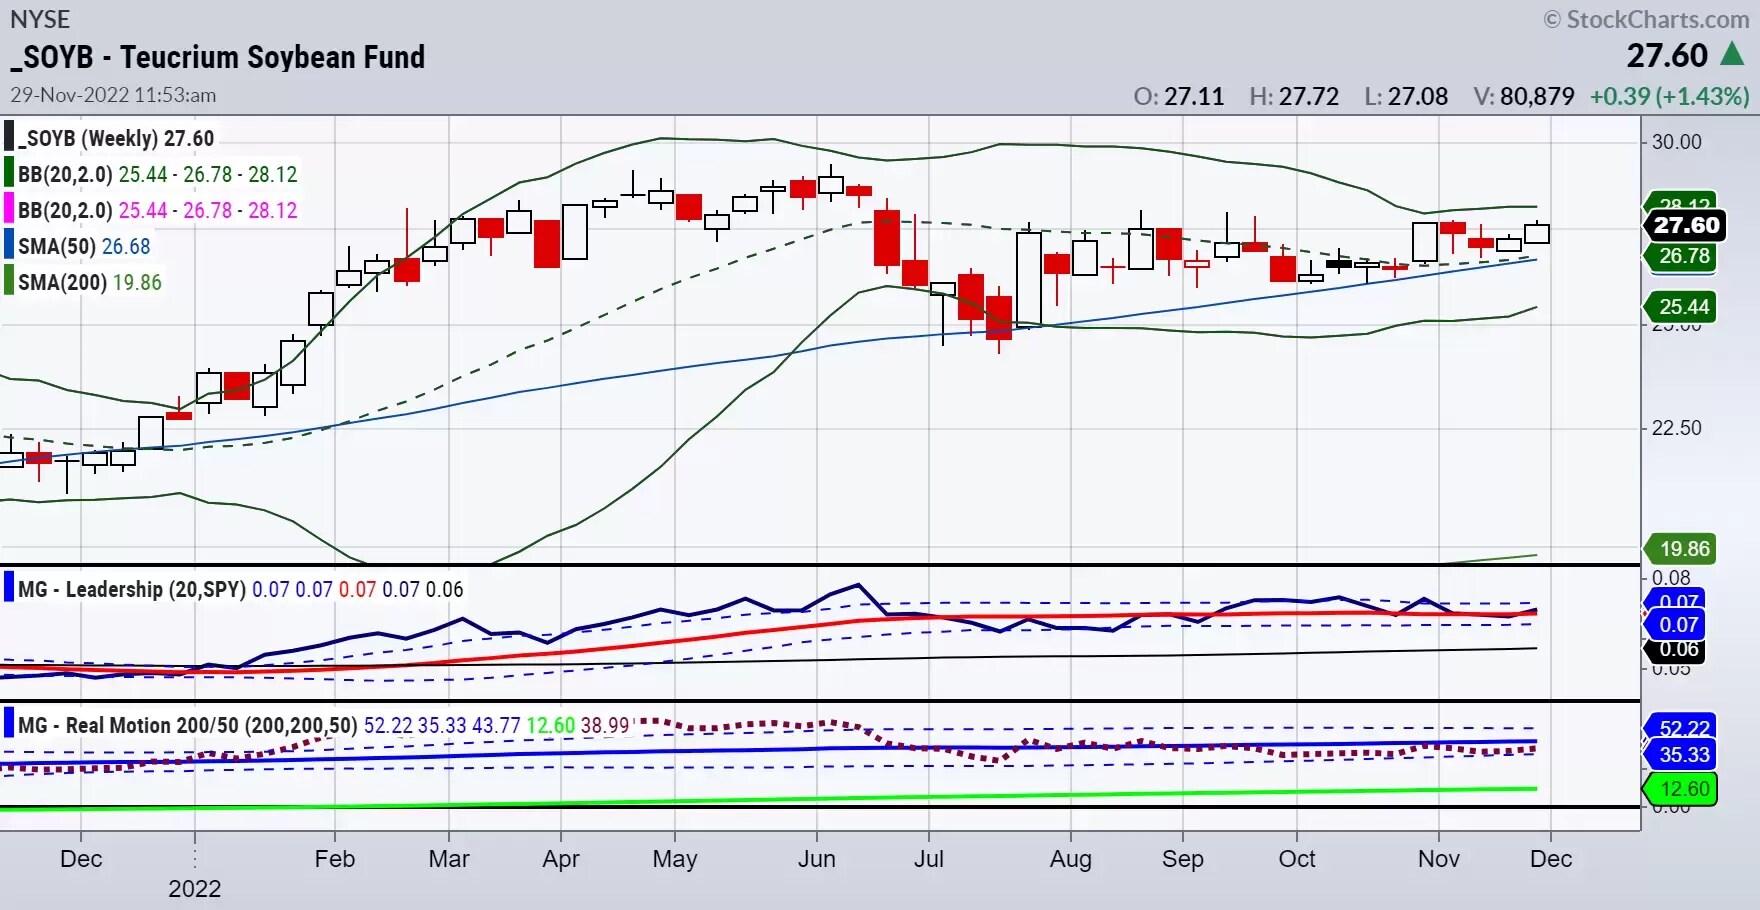
The Teucrium Soybean Fund ETF (SOYB) chart, below, shows resistance in early November at $27.70, with Tuesday’s high at $27.72. If the fund clears that level, it could move above the all-time high of $28.22, and possibly up to around $30. The risk is under $26.50. Leadership against the benchmark is improving, while momentum is flat.
What the Teck?
Natural resources company Teck Resources (TECK) is involved in mining and mineral development. It mines coal for the steelmaking industry, and also produces copper, zinc, and energy. The stock therefore offers exposure to a range of commodities and their uses.
The weekly chart, below, shows the price trying to clear the 50-week moving average (WMA; the blue line). The Leadership indicator is there and momentum could potentially break its 50-WMA. On the daily chart, the momentum indicator has already cleared the 50-DMA.
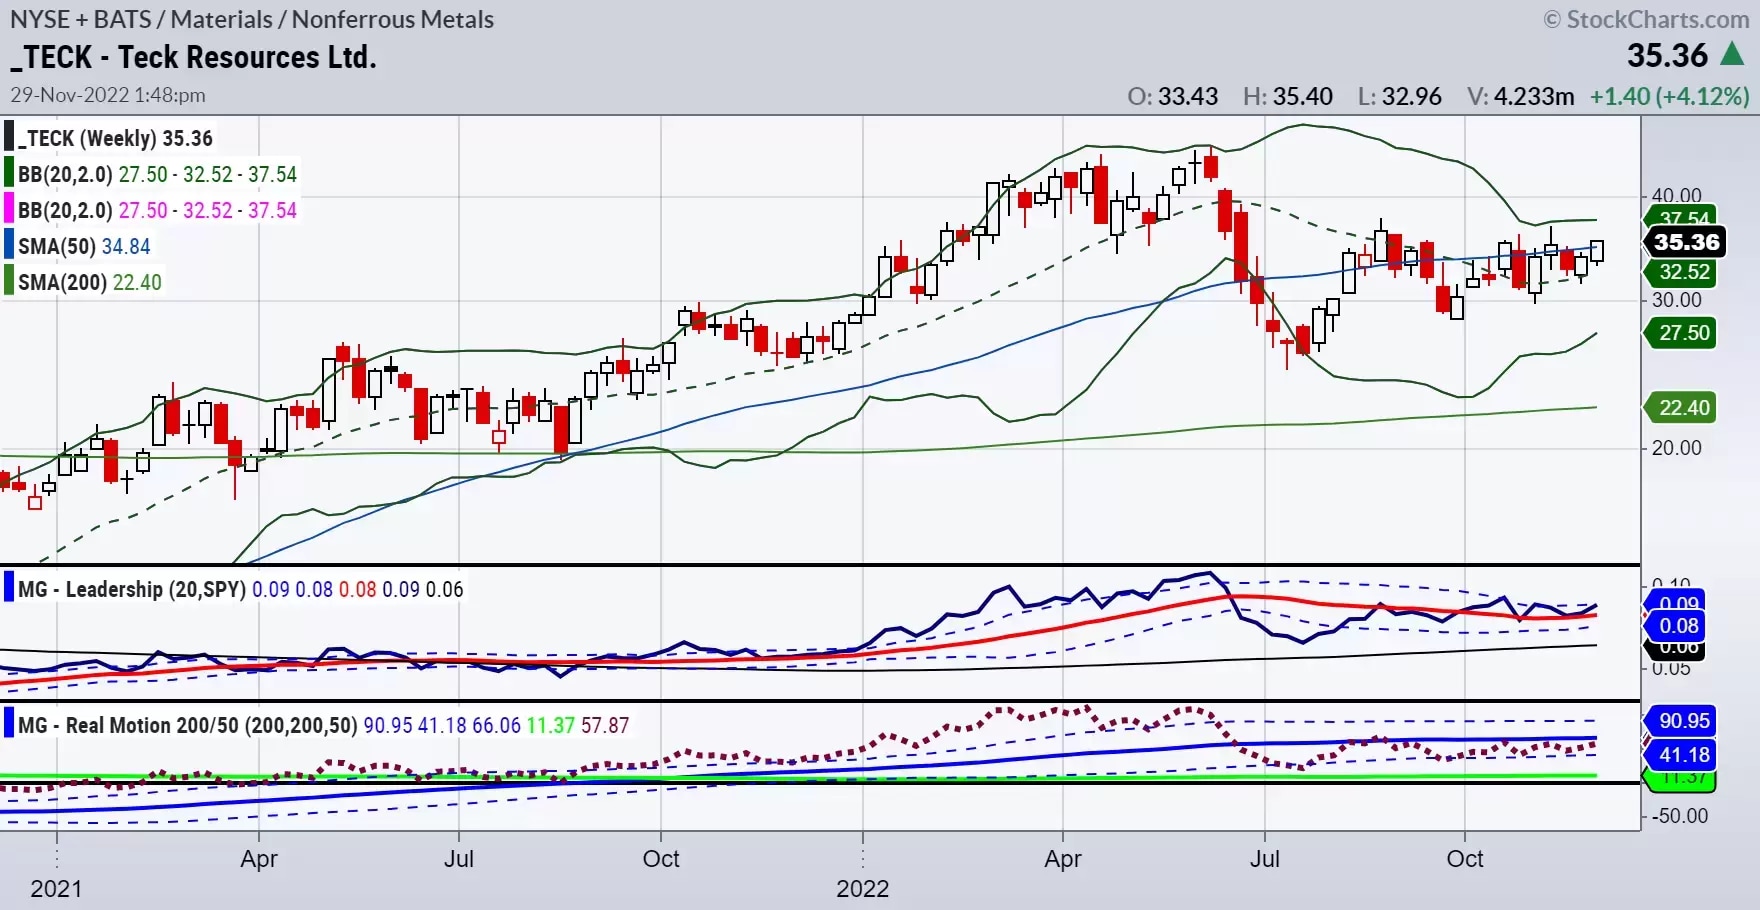
The key support level is around $32. A confirmed move over $35.40 could take TECK to around $45.
The commodity super-cycle, particularly in metals, food and energy, could persist into 2023, potentially making December an apt time for traders to take stock of their exposure to commodities and commodity-related companies.
Mish’s ETF support and resistance levels
S&P 500 (SPY) Resistance at 400-405 remains persistent, with support at 387
Russell 2000 (IWM) 190 is the ultimate point to clear, support to hold 180
Dow (DIA) Needs to hold 335.50 to stay in the game
Nasdaq (QQQ) Weakest index; has to clear 290 or hold 275, otherwise trouble may lie ahead
Regional banks (KRE) 65.00 resistance, 60 support
Semiconductors (SMH) 209 is the biggest support level to hold
Transportation (IYT) 217 support, big resistance at 232
Biotechnology (IBB) 129 support, 135 resistance
Retail (XRT) If it clears 67.00 we could see a Santa’s rally, under 62.00 spells failure
Mish Schneider is MarketGauge’s director of trading education and research. Read more of MarketGauge’s market analysis here, and subscribe to their YouTube channel here. Mish Schneider's and MarketGauge's views and findings are their own, and should not be relied upon as the basis of a trading or investment decision. Pricing is indicative. Past performance is not a reliable indicator of future results.
Disclaimer: CMC Markets is an execution-only service provider. The material (whether or not it states any opinions) is for general information purposes only, and does not take into account your personal circumstances or objectives. Nothing in this material is (or should be considered to be) financial, investment or other advice on which reliance should be placed. No opinion given in the material constitutes a recommendation by CMC Markets or the author that any particular investment, security, transaction or investment strategy is suitable for any specific person. The material has not been prepared in accordance with legal requirements designed to promote the independence of investment research. Although we are not specifically prevented from dealing before providing this material, we do not seek to take advantage of the material prior to its dissemination.


