Last week was an eventful one for watchers of US economic data. On Thursday, the personal consumption expenditures (PCE) reading for October aligned with estimates, but the Institute for Supply Management's (ISM) manufacturing purchasing managers’ index (PMI) came in weaker than expected. Then on Friday we got a hotter-than-expected labour market report.
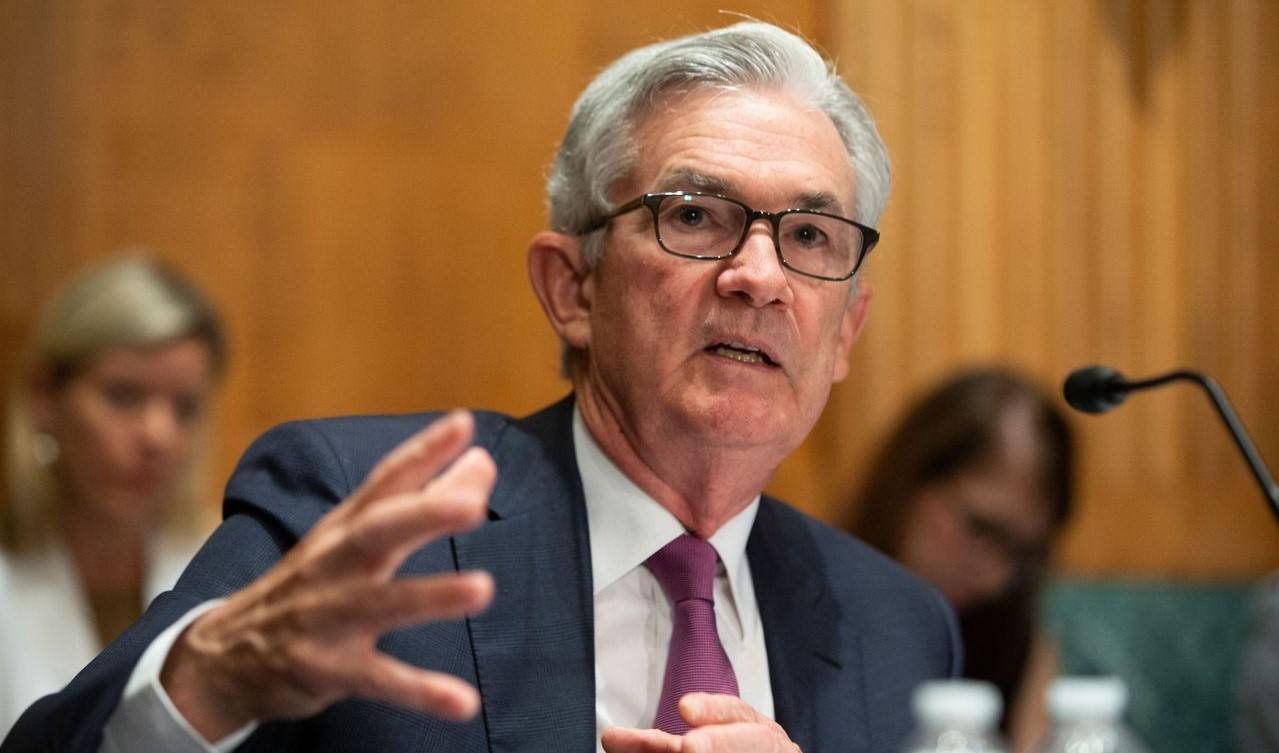
On top of that, Jay Powell signalled that the Federal Reserve could ease the pace of interest rate rises at its mid-December meeting. For some, Powell’s speech at the Brookings Institution on Wednesday raised more questions than it answered. The market response pointed to a risk-off moment, in which investors could become more risk-averse and sell assets, as the global economy heads towards stagflation.
Financial conditions ease
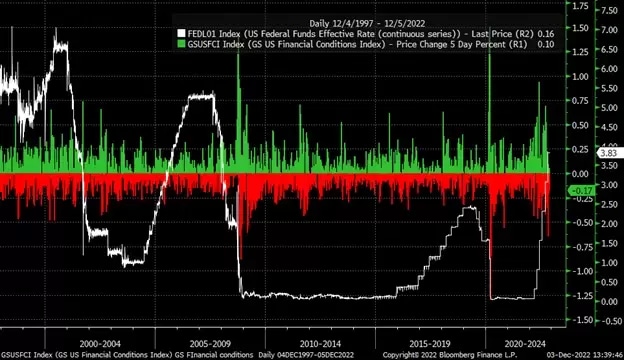
Financial conditions eased further last week and are now back at levels last seen in September, according to economists at Goldman Sachs, who calculate a closely watched index that takes into account US stock market movements, borrowing costs and the value of the dollar.
An easing in financial conditions would normally be associated with interest rate cuts and a loose monetary policy; it is unusual for conditions to ease when the Fed is tightening policy.
Earnings growth accelerating, economic growth slowing
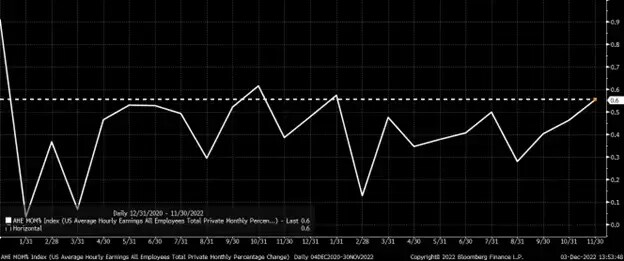
Average hourly earnings in the US increased 0.6% month-on-month in November, according to Friday’s better-than-expected non-farm payrolls report. It was the biggest monthly increase in earnings since January.
In contrast, the ISM’s manufacturing PMI reading of 49.0 points for November, down from October’s 50.2, suggested that the US economy was inching closer to recession. This resulted in the yield curve inversion growing deeper and the dollar selling off hard. The market's view seems to be shifting, with rates and the dollar potentially breaking down after months of an upward trend.
Risk-off signals
Testing resistance at 3.58%, the US 10-year government bond rate reversed hard and finished Friday 2 December and the week lower, closing at 3.48%. That came after a failed attempt to move back above resistance on a hotter-than-expected earnings growth number on Friday morning. The 10-year rate may fall further over the short-term, perhaps to the long-term uptrend at approximately 3.3%.
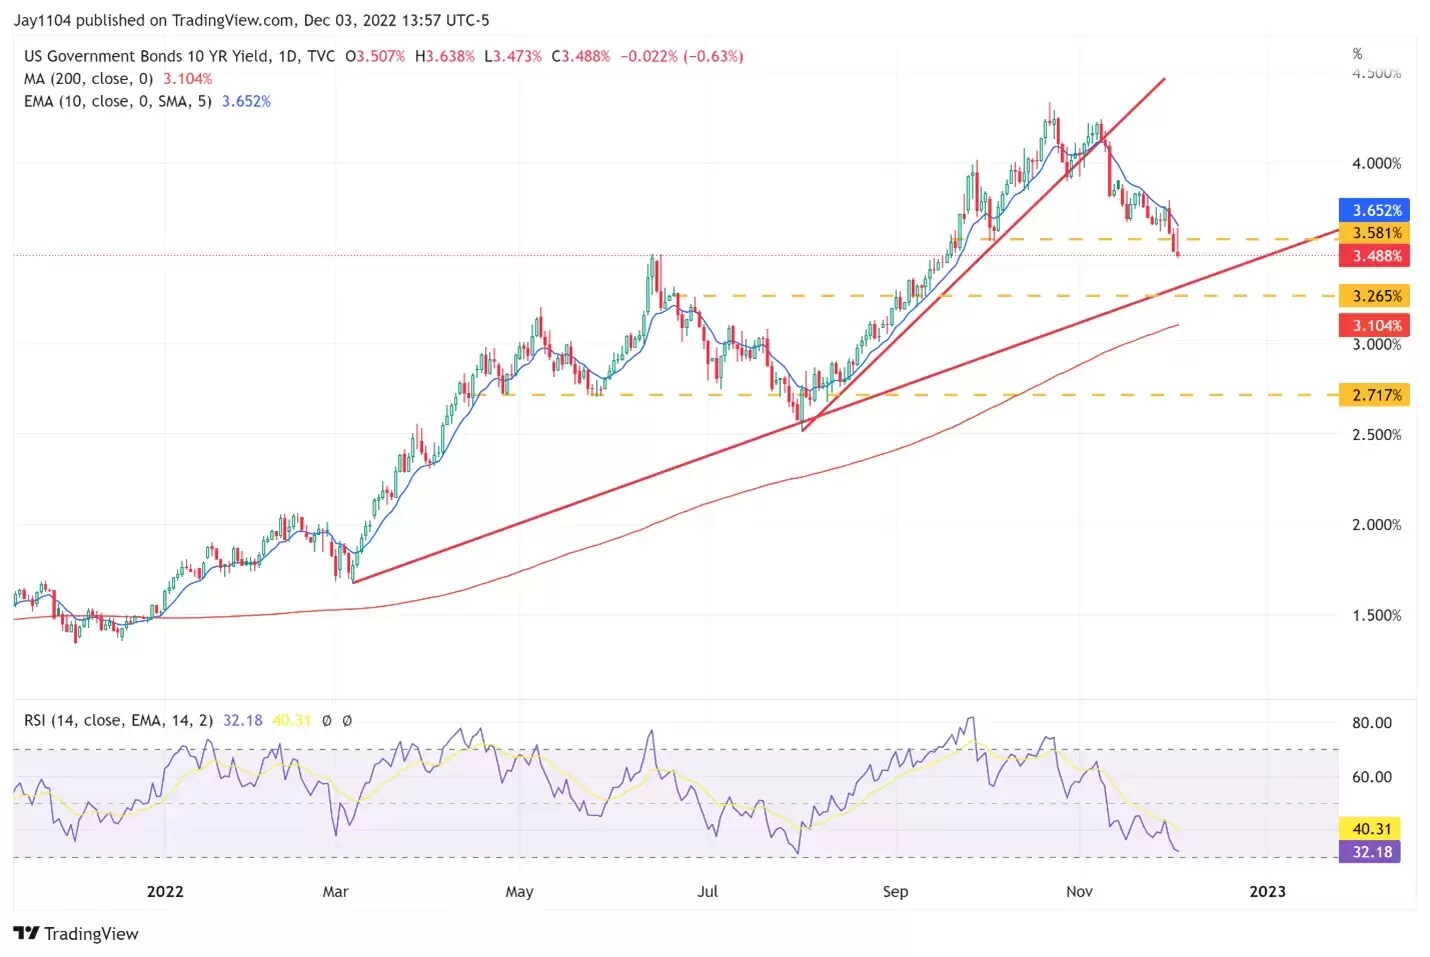
The weaker-than-expected manufacturing PMI reading and the stronger-than-expected earnings data may indicate that the next big problem facing the market could be company earnings and profits. Operating margins are likely to shrink as wages and costs rise. At the same time, higher prices could deter consumers, denting corporate revenues and slowing nominal GDP growth. The potential is for this to be a risk-off signal to US and global markets.
Alongside the US’ disappointing manufacturing print, the data out of China was equally bad. As a result, a major risk-on currency pair, the Australian dollar versus the Japanese yen (AUD/JPY), is breaking down.
The AUD/JPY currency pair is often seen as a risk-on/risk-off gauge, and that technical chart has broken sharply. The Aussie dollar is highly leveraged to China, and given the weakening China outlook, it is no wonder that this currency pair may be on the cusp of declining sharply.
At the time of writing, AUD/JPY is sitting on a critical support level at ¥91 to the Aussie dollar. A break of that support level could indicate that the yen is likely to strengthen versus the Aussie dollar, potentially sending the latter down to a valuation around ¥88.
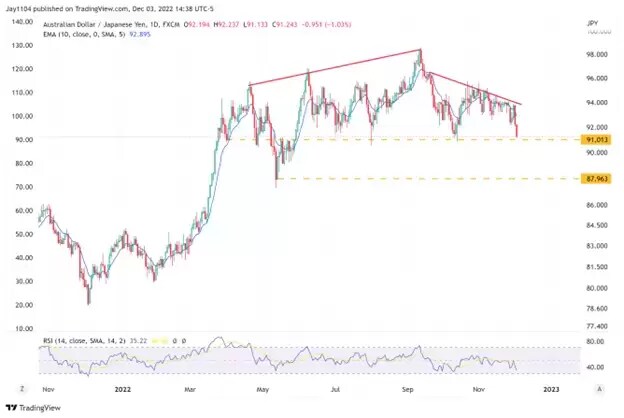
The currency pair is also highly correlated to oil prices, since China is a big oil consumer, while higher oil prices hurt the Japanese economy. A breakdown in the AUD/JPY would also be a negative indicator for oil and a potential indication that oil could be heading lower.
Brent crude oil prices have dropped dramatically, despite suggestions that OPEC may look to cut supply at the next meeting. One would have expected oil to rebound on that news, and it did at first. However, price action, like that seen in the 10-year yield on Friday, saw Brent prices rise sharply but fail to push and hold above the trendline, which has now turned into resistance. This would suggest that prices could fall. If that turns out to be the case, then oil prices could be heading back to the mid-$60 range.
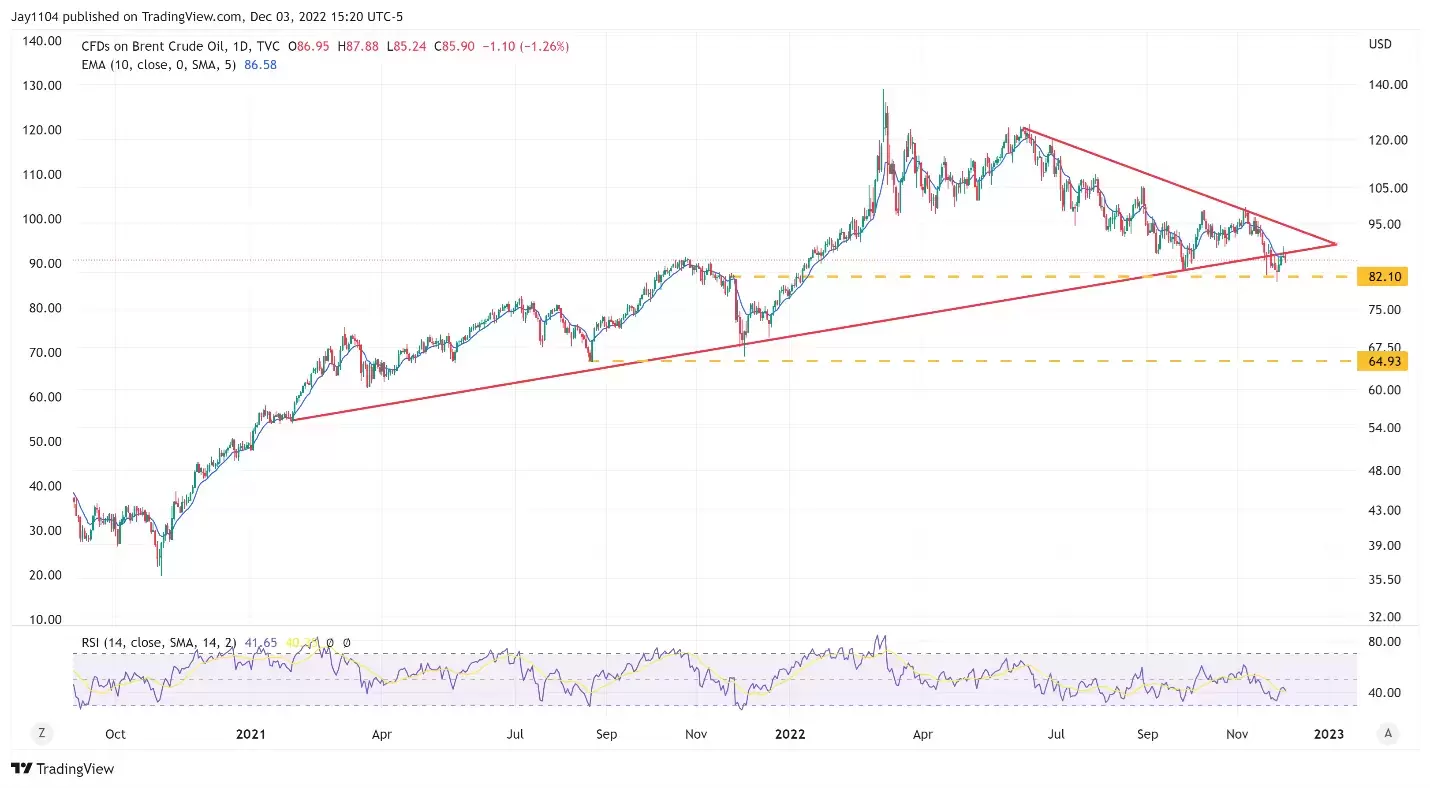
When news breaks and the market response runs counter to expectations, that can be a sign of a change in the market. In this case, the tone of Jay Powell’s speech suggested that the Fed is at peace with the easing of financial conditions, which may signal that policymakers expect slower growth and rising wages to push the economy closer to a stagflationary environment.
Charts used with the permission of Bloomberg Finance LP. This report contains independent commentary to be used for informational and educational purposes only. Michael Kramer is a member and investment adviser representative with Mott Capital Management. Mr Kramer is not affiliated with this company and does not serve on the board of any related company that issued this stock. All opinions and analyses presented by Michael Kramer in this analysis or market report are solely Michael Kramer's views. Readers should not treat any opinion, viewpoint, or prediction expressed by Michael Kramer as a specific solicitation or recommendation to buy or sell a particular security or follow a particular strategy. Michael Kramer's analyses are based upon information and independent research that he considers reliable, but neither Michael Kramer nor Mott Capital Management guarantees its completeness or accuracy, and it should not be relied upon as such. Michael Kramer is not under any obligation to update or correct any information presented in his analyses. Mr. Kramer's statements, guidance, and opinions are subject to change without notice. Past performance is not indicative of future results. Past performance of an index is not an indication or guarantee of future results. It is not possible to invest directly in an index. Exposure to an asset class represented by an index may be available through investable instruments based on that index. Neither Michael Kramer nor Mott Capital Management guarantees any specific outcome or profit. You should know the real risk of loss in following any strategy or investment commentary presented in this analysis. Strategies or investments discussed may fluctuate in price or value. Investments or strategies mentioned in this analysis may not be suitable for you. This material does not consider your particular investment objectives, financial situation, or needs and is not intended as a recommendation appropriate for you. You must make an independent decision regarding investments or strategies in this analysis. Upon request, the advisor will provide a list of all recommendations made during the past 12 months. Before acting on information in this analysis, you should consider whether it is suitable for your circumstances and strongly consider seeking advice from your own financial or investment adviser to determine the suitability of any investment. Michael Kramer and Mott Capital received compensation for this article.
Disclaimer: CMC Markets is an execution-only service provider. The material (whether or not it states any opinions) is for general information purposes only, and does not take into account your personal circumstances or objectives. Nothing in this material is (or should be considered to be) financial, investment or other advice on which reliance should be placed. No opinion given in the material constitutes a recommendation by CMC Markets or the author that any particular investment, security, transaction or investment strategy is suitable for any specific person. The material has not been prepared in accordance with legal requirements designed to promote the independence of investment research. Although we are not specifically prevented from dealing before providing this material, we do not seek to take advantage of the material prior to its dissemination.


