US markets rallied yesterday after consumer price inflation continued to ease in November, strengthening the Federal Reserve’s case for slowing the pace of interest rate rises.
The US consumer price index (CPI) rose 7.1% in the year to November, down from October’s 7.7% uptick. The softer-than-expected inflation reading buoyed the S&P 500, which closed Tuesday 0.73% higher. The latest inflation data also increase the likelihood that the Fed will raise interest rates by 50 basis points (bps) on Wednesday. The central bank has raised rates by 75 bps at each of its four previous meetings in its battle against high inflation.
Looking ahead to 2023, although I don’t foresee a massive equities rally, the rate of inflation could continue to soften, particularly in areas such as fuel and healthcare as prices in these sectors normalise to pre-Covid levels. I also expect the US dollar to continue to fall, while ongoing geopolitical tensions could cause food and oil shortages. Additionally, China is heading for a full reopening, which is likely to boost the country’s demand for goods and services.
Turning our attention back to the present, let’s look at two key members of my Economic Modern Family – a group of exchange-traded funds (ETFs) that together paint a broad picture of the US economy.
Could markets fall as we approach the end of 2022?
The ETFs I’d like to focus on – the iShares Russell 2000 ETF [IWM] and the SPDR S&P Regional Banking ETF [KRE] – have seen year-to-date declines of 19.5% and 17.4%, respectively. Although yesterday’s inflation data buoyed markets, my analysis suggests that these ETFs could be set to fall further in the final weeks of the year.
First, let’s look at IWM. With 2,000 small-cap stocks in its basket, the granddad of my ETF family offers a measure of the real US economy. The weekly chart, below, suggests that the market could fall rather than rise as 2022 draws to a close.
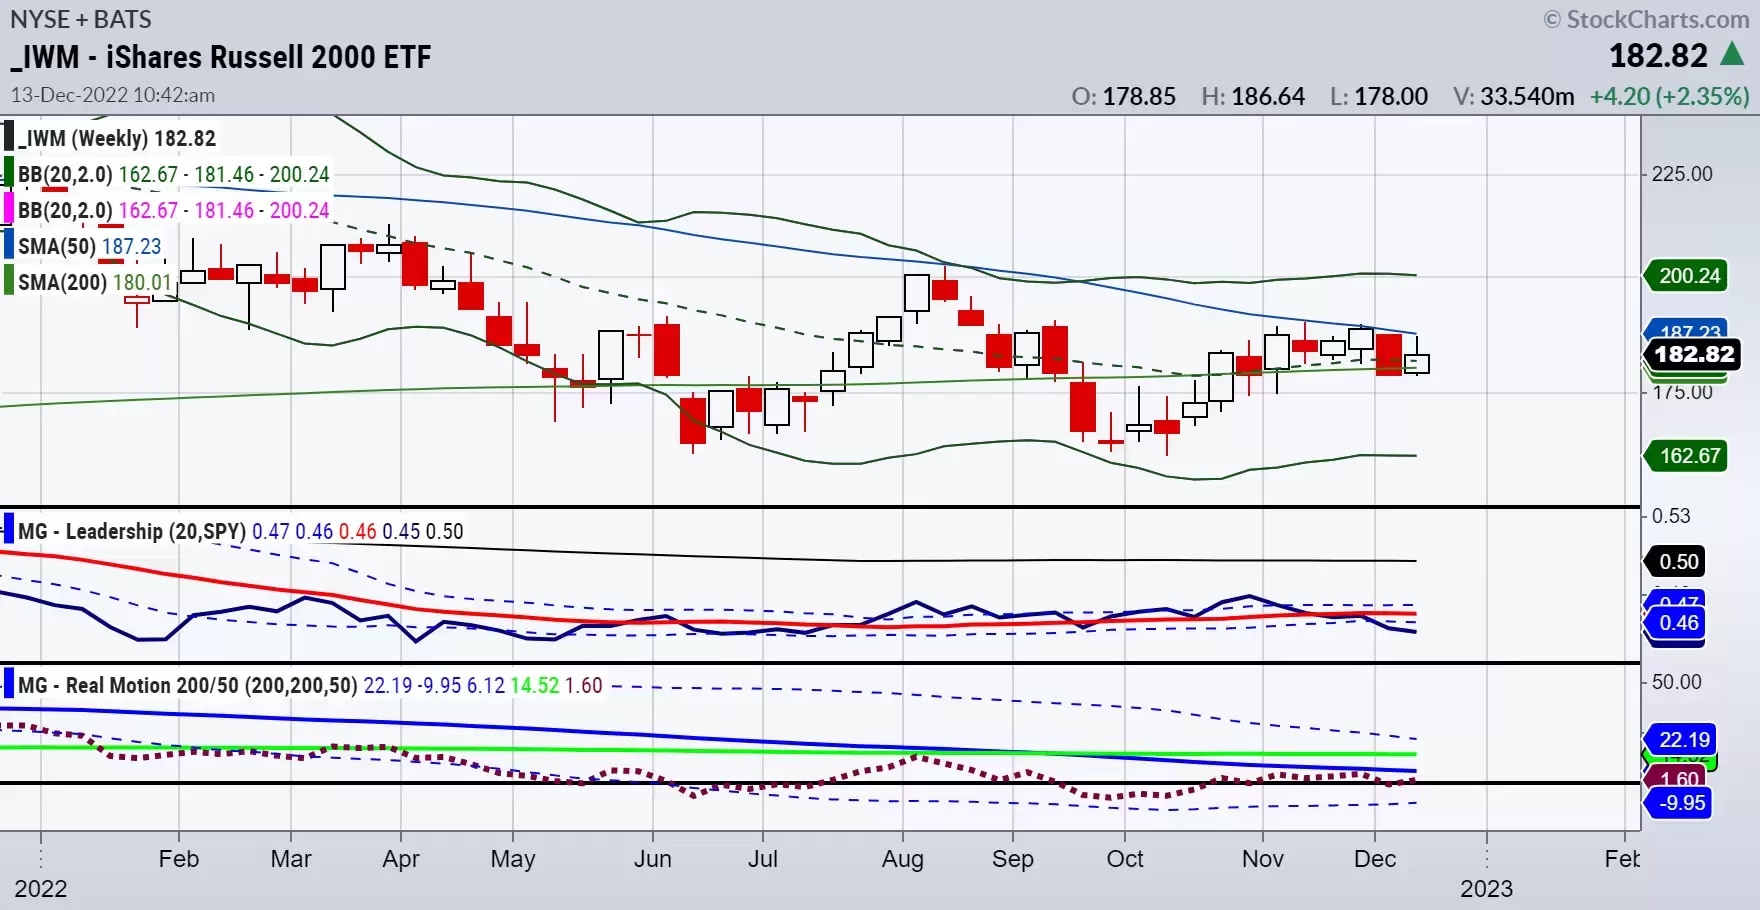
Here are my four key takeaways, based on the above chart:
1. The S&P 500, which provides the benchmark in MarketGauge’s proprietary Leadership indicator, is vastly outperforming IWM. This may reflect expectations of falling inflation and a Fed pivot on interest rates. Also, the S&P can benefit from corporate buybacks, while the small-cap Russell 2000 tends to be shaped by the bottom line of balance sheets.
2. Last week, IWM closed below its 200-week moving average (WMA). This week, at the time of writing, IWM is trading above its 200-WMA. That makes $180 a pivotal level to watch this week.
3. The downward sloping 50-WMA (the blue line) is approaching the 200-WMA (light green line). If IWM closes below $180 this week, I will be monitoring the weekly chart for signs of a death cross – a chart pattern that, in this case, would see the 50-WMA drop below the 200-WMA, indicating price weakness.
4. Our Real Motion indicator entered a death cross in mid-September. Since then, the dotted lines have not cleared back over the 50-WMA. For signs that the market is improving, $180 needs to hold, our Leadership and Momentum indicators need to rise, and price needs to clear $190.
Second, let’s take a look at KRE, the regional banking ETF. The health of regional banks is important since many Americans put their money in such institutions. KRE is sensitive to the Fed’s rate decisions because interest rates are key to banks’ profitability. The fund can also reflects changes in consumers’ borrowing and saving habits.
With savings heading to multi-year lows and credit card debt on the rise, the KRE price chart, below, says a lot.
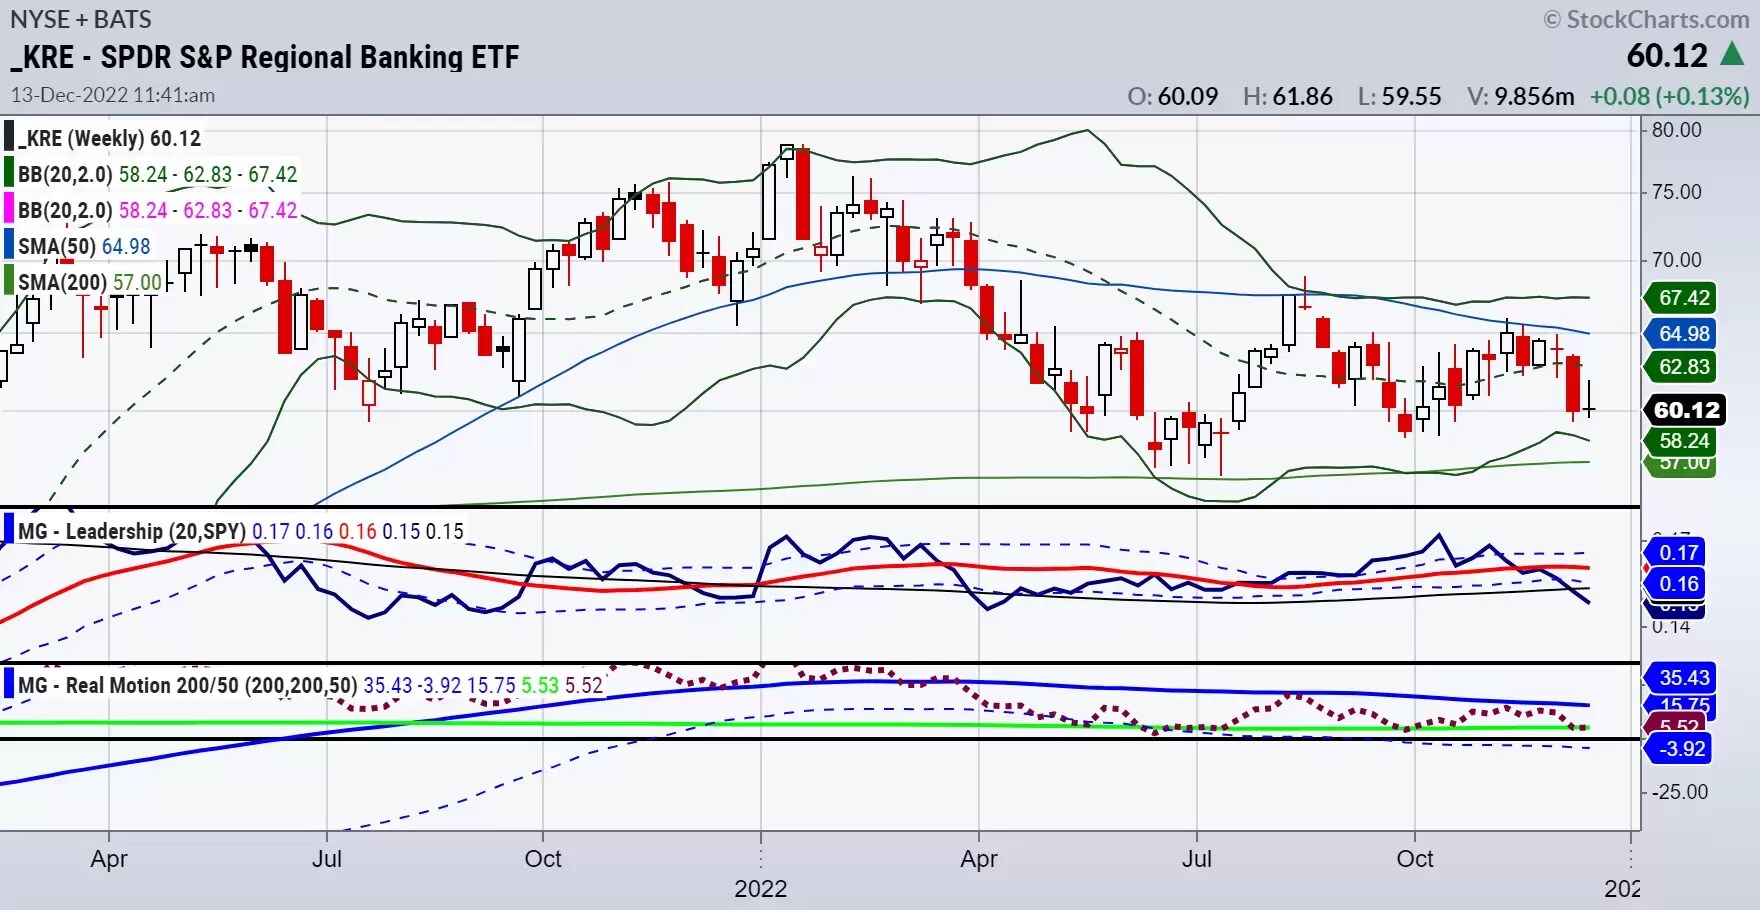
These are my four key takeaways based on the data:
1. The benchmark S&P 500 is outperforming KRE on our Leadership indicator, similar to how the index is outperforming IWM, as discussed above.
2. KRE has not yet closed below its 200-WMA. That makes $57 a key support level to watch in the next couple of weeks. The strength of this level, alongside the performance of IWM, will play a key role in shaping how markets fare at the start of 2023.
3. The distance between KRE’s 50- and 200-WMAs is wider than is the case for IWM, suggesting that KRE is at less risk of displaying a death cross than IWM.
4. Our Real Motion indicator remains in a bullish phase, with the 50-WMA above the 200-WMA. However, our data also indicate that momentum is weakening.
So, although US inflation is easing and the Fed is likely to opt for a smaller interest rate rise this week, IWM and KRE are telling us that US markets have not yet found real relief. We may see further declines in these ETFs before the year is out.
Mish’s ETF support and resistance levels
S&P 500 (SPY) The 50-WMA looms above with resistance at 410; unless that level is cleared, SPY could fall to the 50-DMA support level at 380
Russell 2000 (IWM) 190 is resistance, 177-180 support must hold
Dow (DIA) The only index above its 50-WMA; Tuesday’s action may have spawned a key reversal top if DIA cannot reach 348 again
Nasdaq (QQQ) Matched recent highs at 297 before selling off on Tuesday; can it hold 277?
Regional banks (KRE) 57 support, 60 pivotal
Semiconductors (SMH) Tested 230 and its 50-WMA, then declined; 223 support
Transportation (IYT) Ran to its 50-WMA and sold off; 218 support
Biotechnology (IBB) Best sector in a consolidation mode, unless it breaks below 130
Retail (XRT) Never cleared over 67, now we watch 63 as major support
Disclaimer: CMC Markets is an execution-only service provider. The material (whether or not it states any opinions) is for general information purposes only, and does not take into account your personal circumstances or objectives. Nothing in this material is (or should be considered to be) financial, investment or other advice on which reliance should be placed. No opinion given in the material constitutes a recommendation by CMC Markets or the author that any particular investment, security, transaction or investment strategy is suitable for any specific person. The material has not been prepared in accordance with legal requirements designed to promote the independence of investment research. Although we are not specifically prevented from dealing before providing this material, we do not seek to take advantage of the material prior to its dissemination.


