Two major US economic announcements this week have the potential to move markets and shape the Federal Reserve’s thinking on interest rates. The country’s fourth-quarter gross domestic product (GDP) print is due on Thursday 26 January, followed on Friday by the December reading of the core personal consumption expenditures (PCE) price index, which is said to be the Fed’s preferred measure of inflation. The two reports come a week before the Federal Open Market Committee meets to discuss interest rates, with a rate hike expected to be announced on 1 February.
Analysts estimate that US GDP increased 2.6% in the three months to the end of December, down from 3.2% in the third quarter. Meanwhile, the GDP price index, which measures inflation in the prices of goods and services, is estimated to have risen 3.2% in Q4, down from 4.4% in Q3.
Meanwhile, the headline PCE price index is expected to have grown 5% in the year to December, easing from 5.5% in November. The core PCE price index, which excludes volatile food and energy prices, is expected to have climbed 4.4% year-on-year, down from 4.7% in November.
Both announcements – Q4 GDP and December PCE – are critical because they will tell the market whether or not the Fed has more work to do to tame inflation. Stock markets, which believe that the Fed has already done too much, are trying to run in front of the Fed, with the S&P 500, the Nasdaq 100 and the Dow Jones Industrial Average all well above their October lows. Meanwhile, the bond market expects the Fed to stop tightening and cut rates later this year, based on Fed funds futures, as shown in the chart below.
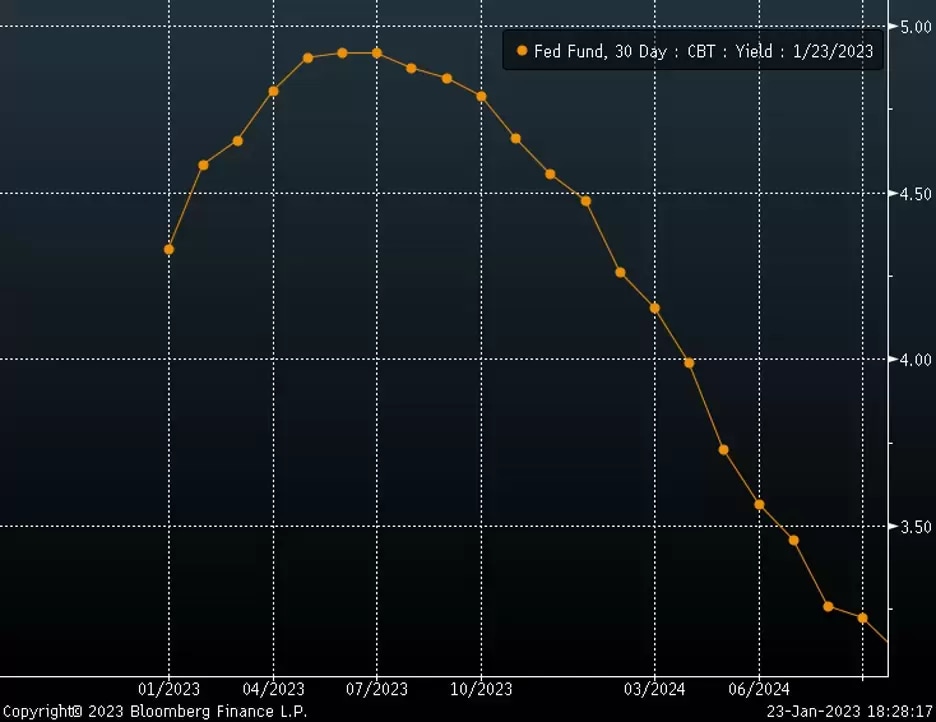
Stronger-than-expected GDP growth and PCE inflation could cast doubt over the notion that the Fed is nearing the end of its tightening cycle, and might suggest that more work needs to be done.
S&P 500 at a turning point
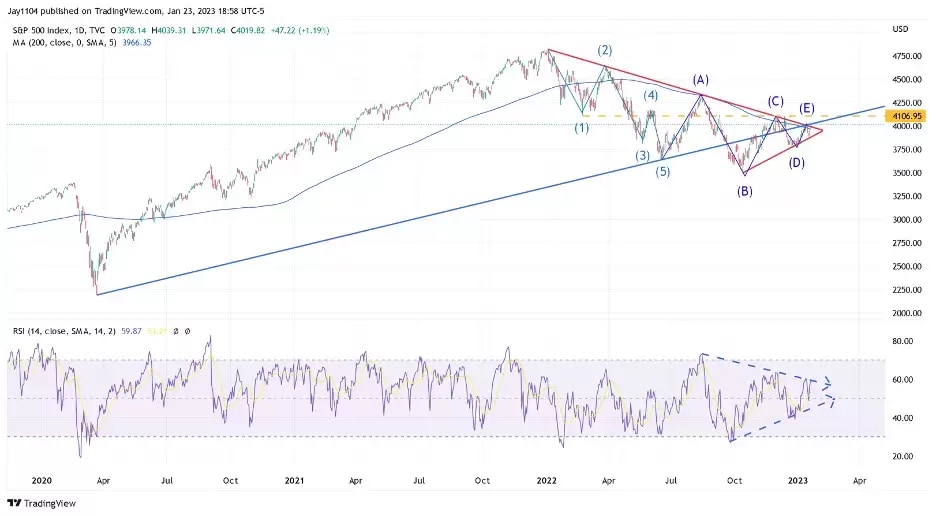
The S&P 500 finds itself at a critical inflection point, as the chart below shows. The index is flirting with a break above its 200-day moving average and the trendline that has been in place since the January 2022 peak. It has also started to show signs of a new uptrend that started from the October lows. These two trend lines are converging and are likely to determine whether the bear market continues or the index moves higher.
However, from a bullish perspective, a rally may be challenging as the long-term trendline off the March 2020 low has provided resistance on several occasions. Meanwhile, a wave count indicates that the index is in a symmetrical triangle. If this pattern were to continue, the index could move lower.
Nasdaq 100 in consolidation phase
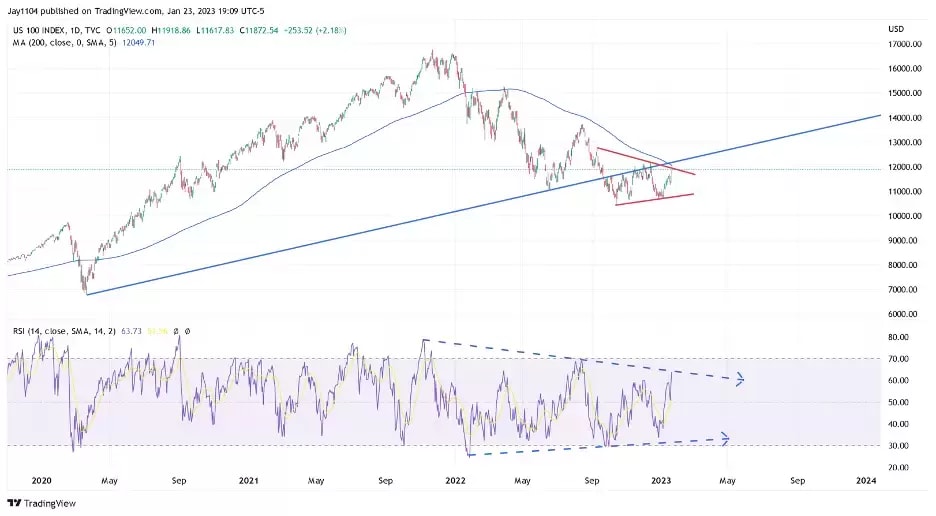
The Nasdaq 100 also appears to be consolidating. However, it has a big battle ahead, with an uptrend since the March 2020 low and a symmetrical triangle providing resistance. A falling 200-day moving average – the thin blue line on the chart below – is also approaching.
Meanwhile, the relative strength index (RSI), shown in the lower portion of the chart, continues to post lower highs, suggesting that the Nasdaq 100’s rally may run out of steam. Even if the RSI were to break the downtrend, it is currently at a reading of 63, close to overbought levels above 70.
Dow nears key resistance level
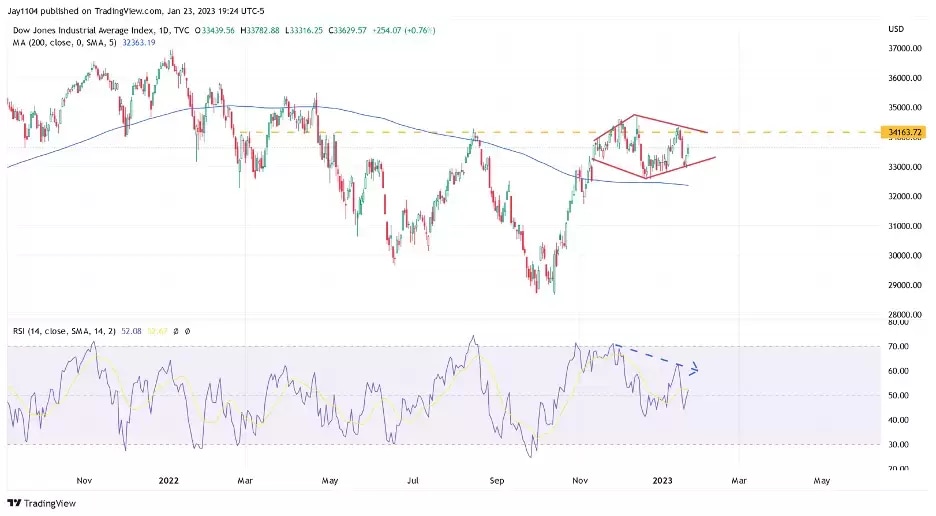
The Dow is already trading above its 200-day moving average, which is likely to act as support. However, there is resistance around the 34,200 area, which has been at the top of the trading range since April.
Additionally, the index has been consolidating sideways since November. As a result, there is an argument to be made that the average has formed a diamond reversal pattern over the past two months. Momentum in the Dow has been bearish, as indicated by the lower high on the RSI.
With the stock market betting that the Fed is near the end of its tightening cycle and on a path to cutting interest rates at some point later this year, there may be downside risk for stocks if Q4 GDP and December PCE point to further rate hikes. Alternatively, if the two announcements provide evidence that the US economy is weakening or close to making a soft landing, equity markets could move higher.
Charts used with the permission of Bloomberg Finance LP. This report contains independent commentary to be used for informational and educational purposes only. Michael Kramer is a member and investment adviser representative with Mott Capital Management. Mr Kramer is not affiliated with this company and does not serve on the board of any related company that issued this stock. All opinions and analyses presented by Michael Kramer in this analysis or market report are solely Michael Kramer's views. Readers should not treat any opinion, viewpoint, or prediction expressed by Michael Kramer as a specific solicitation or recommendation to buy or sell a particular security or follow a particular strategy. Michael Kramer's analyses are based upon information and independent research that he considers reliable, but neither Michael Kramer nor Mott Capital Management guarantees its completeness or accuracy, and it should not be relied upon as such. Michael Kramer is not under any obligation to update or correct any information presented in his analyses. Mr. Kramer's statements, guidance, and opinions are subject to change without notice. Past performance is not indicative of future results. Past performance of an index is not an indication or guarantee of future results. It is not possible to invest directly in an index. Exposure to an asset class represented by an index may be available through investable instruments based on that index. Neither Michael Kramer nor Mott Capital Management guarantees any specific outcome or profit. You should know the real risk of loss in following any strategy or investment commentary presented in this analysis. Strategies or investments discussed may fluctuate in price or value. Investments or strategies mentioned in this analysis may not be suitable for you. This material does not consider your particular investment objectives, financial situation, or needs and is not intended as a recommendation appropriate for you. You must make an independent decision regarding investments or strategies in this analysis. Upon request, the advisor will provide a list of all recommendations made during the past 12 months. Before acting on information in this analysis, you should consider whether it is suitable for your circumstances and strongly consider seeking advice from your own financial or investment adviser to determine the suitability of any investment. Michael Kramer and Mott Capital received compensation for this article.
Disclaimer: CMC Markets is an execution-only service provider. The material (whether or not it states any opinions) is for general information purposes only, and does not take into account your personal circumstances or objectives. Nothing in this material is (or should be considered to be) financial, investment or other advice on which reliance should be placed. No opinion given in the material constitutes a recommendation by CMC Markets or the author that any particular investment, security, transaction or investment strategy is suitable for any specific person. The material has not been prepared in accordance with legal requirements designed to promote the independence of investment research. Although we are not specifically prevented from dealing before providing this material, we do not seek to take advantage of the material prior to its dissemination.


