RRG Research's Trevor Neil this week looks at the dominance of US indices and the strength of the US dollar versus the rest of the world’s major currencies.
The Relative Rotation Graph shows the rotation for a group of major world stock market indexes sampled on a weekly basis. The big picture essentially remains the same, with many tails inside the leading quadrant, offsetting the weight of the US dollar markets within the MSCI world, which is the benchmark for this chart.
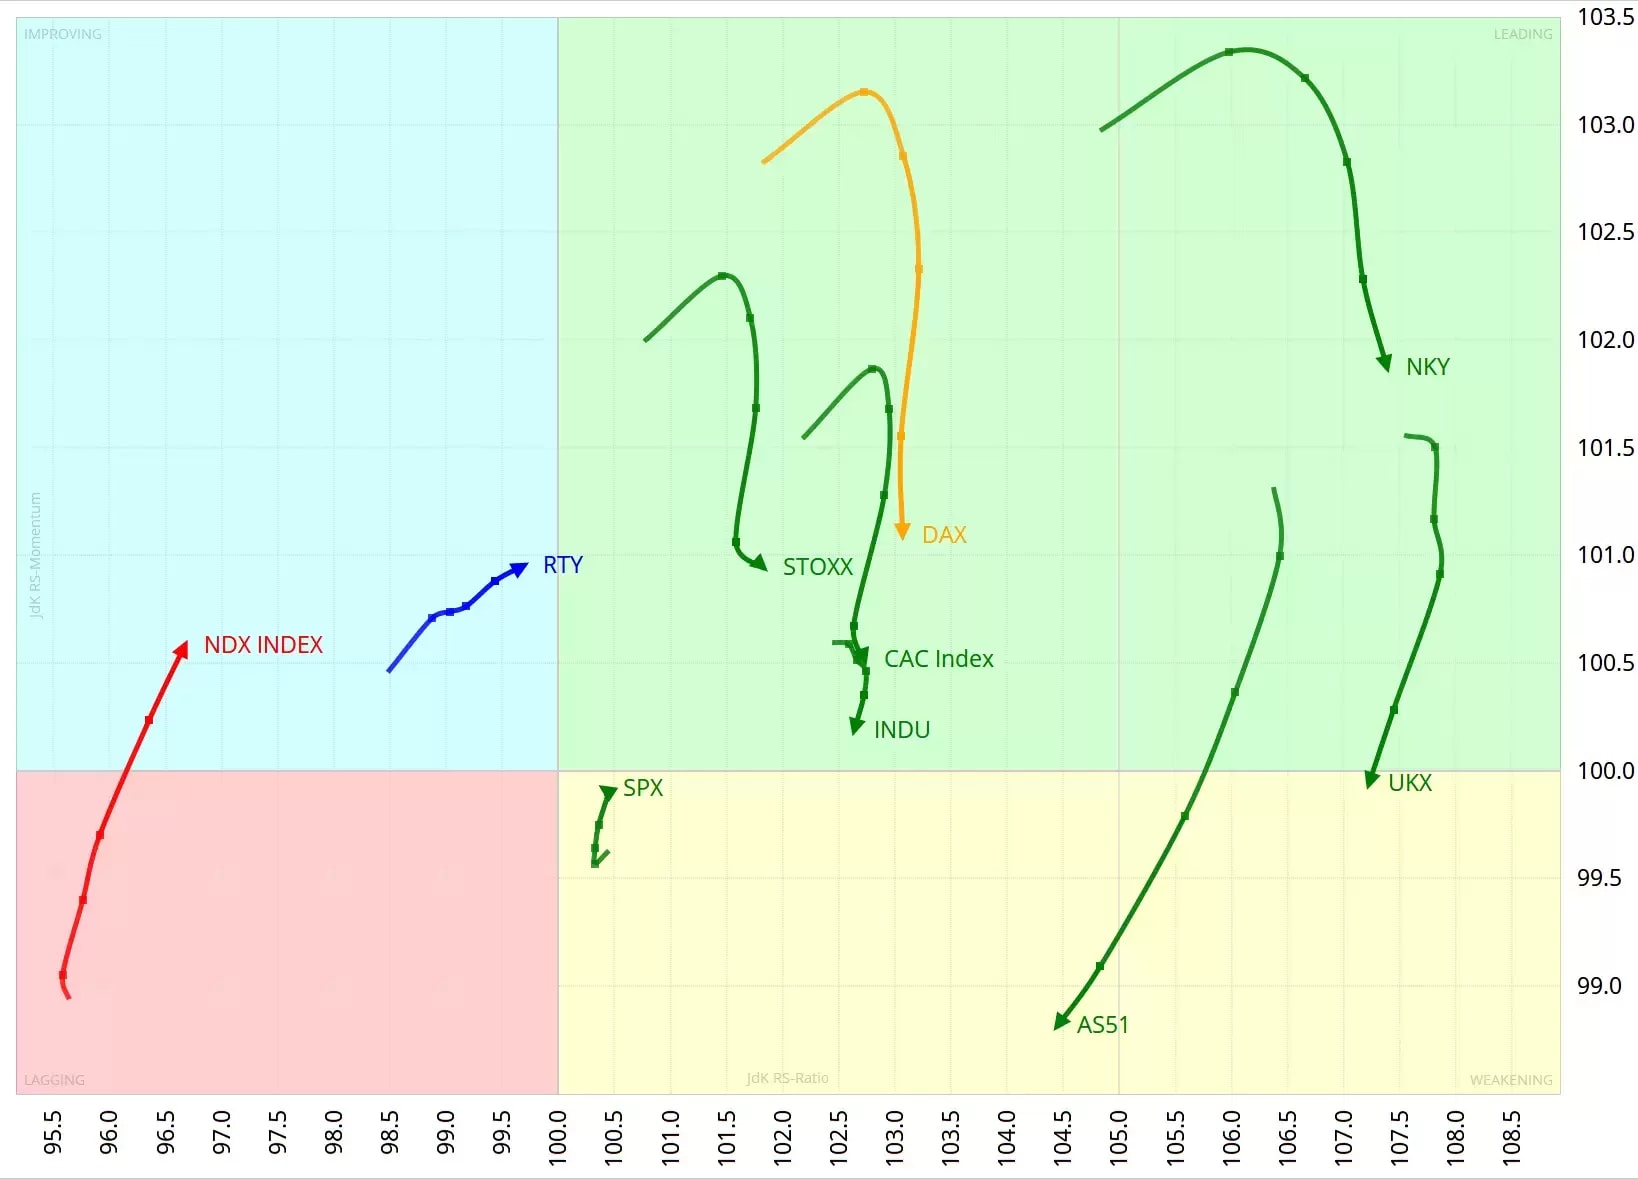
The trend of a lot of the tails inside the leading quadrant rolling over and losing relative momentum (JdK RS-Momentum dropping) has developed further. This rolling over is causing the direction for those tails to change to south-west. The S&P index (SPX) and NASDAQ 100 (NDX) alone are pointing up – increasing JdK RS-Momentum.
One index has moved to a new quadrant. The UK 100 (UKX) journey has moved it from the leading to weakening quadrant. It looks to be following the relative route of the Australia 200 (AS51). However, it’s doing so from the point of a strong JdeK RS-Ratio. In that respect, it’s holding up well compared with its European counterparts.
The main takeaway from this is that the big picture is still for the world to be in a relative uptrend versus the US. But in the near term, this may change. We cannot yet answer the big question of whether these changes are temporary and, eventually, the prevailing longer-term trend will continue. Or is it the start of a turnaround and a new trend in the opposite direction? It’s too early to say.
Broad-based dominance in US indices
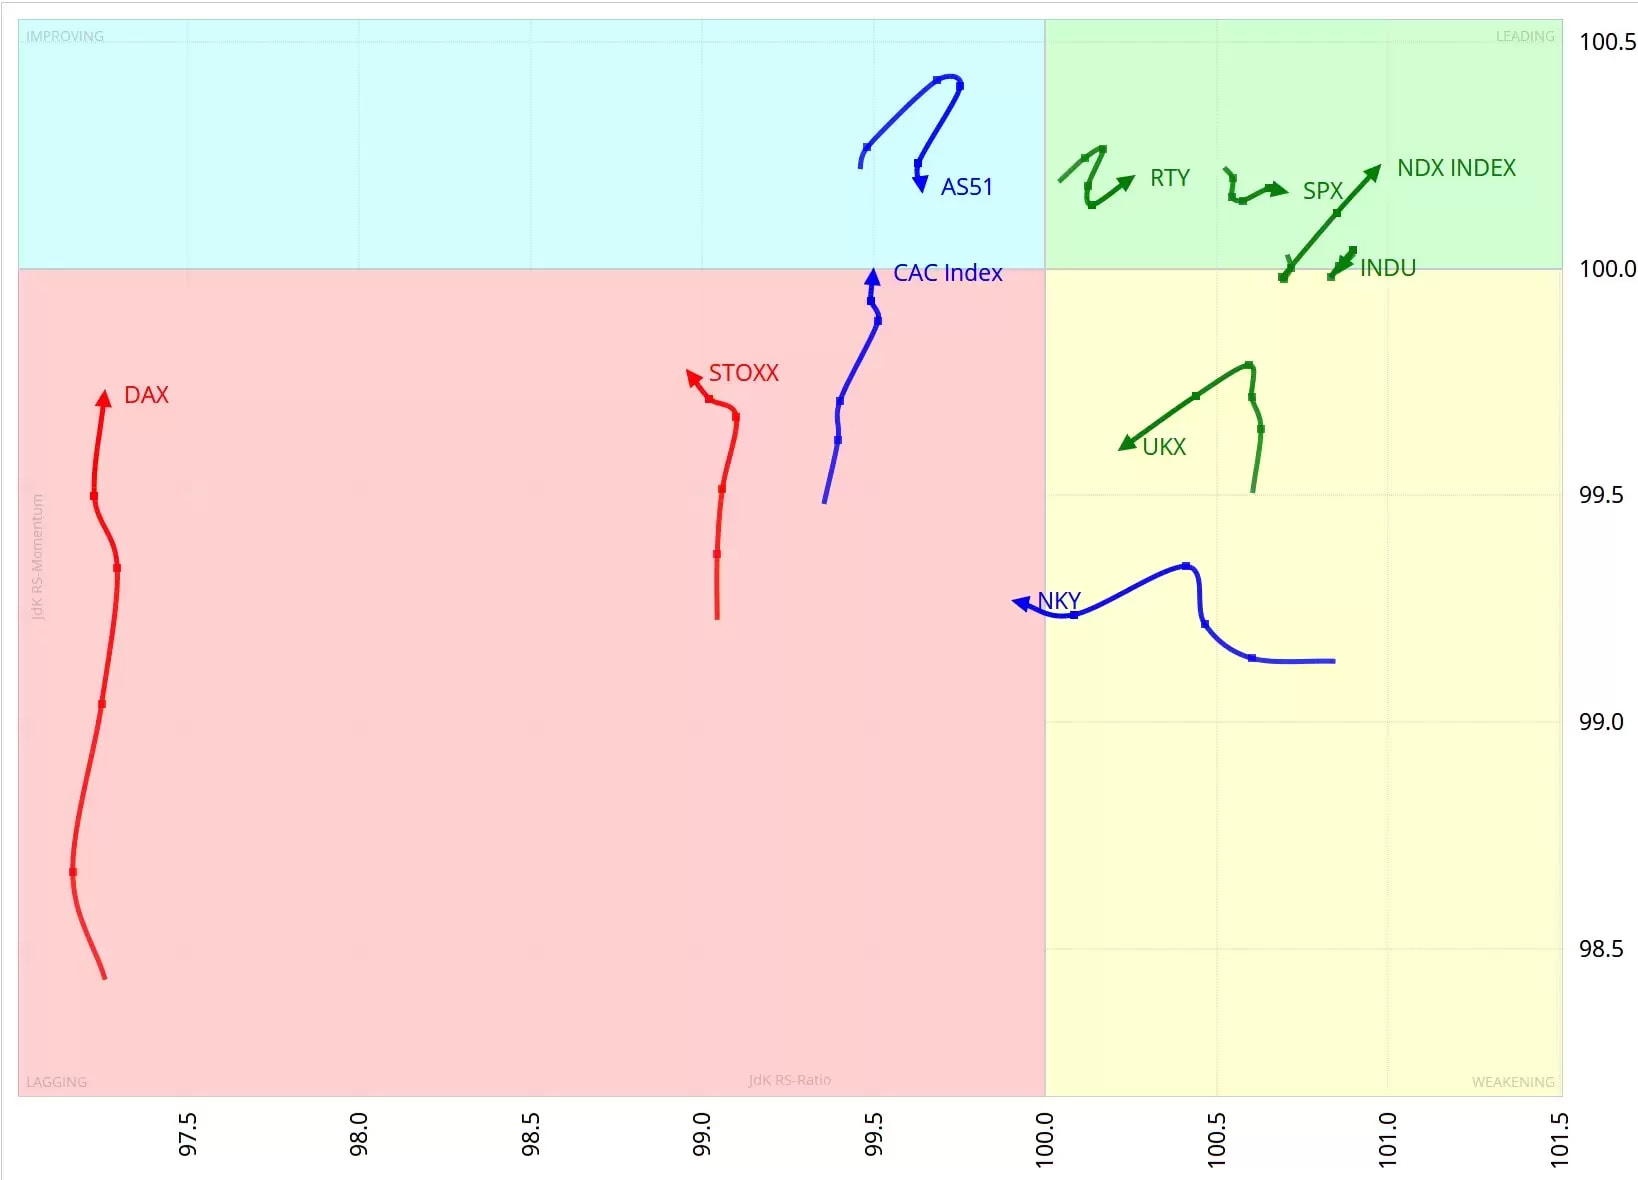
When we drill down to the daily RRG, we see that the movement of non-US markets is still losing relative momentum. This trend has continued over the last two weeks. The leading quadrant is populated solely by US indices. The healthy US market structure of broad-based US dominance has continued when strength is across many stocks rather than just a few. Broad-based indices like the Rusell 2000 (RTY) and narrowly-based indices like the Dow 30 (INDU) are leading together. The takeaway from this observation is that the broader US market is catching up and potentially overtaking heavyweights. This message is positive for the US market.
USD becomes king of kings
The weekly RRG for currencies still shows the continued massive strength of the US dollar against the rest of the world's (G10) currencies. Most currencies are in the lagging quadrant. The USD is the undisputed king. Major currencies have been hit in varying degrees. The EUR and GBP have been hit hard. The CHF continued its improvement from last week, and has moved into the improving quadrant.
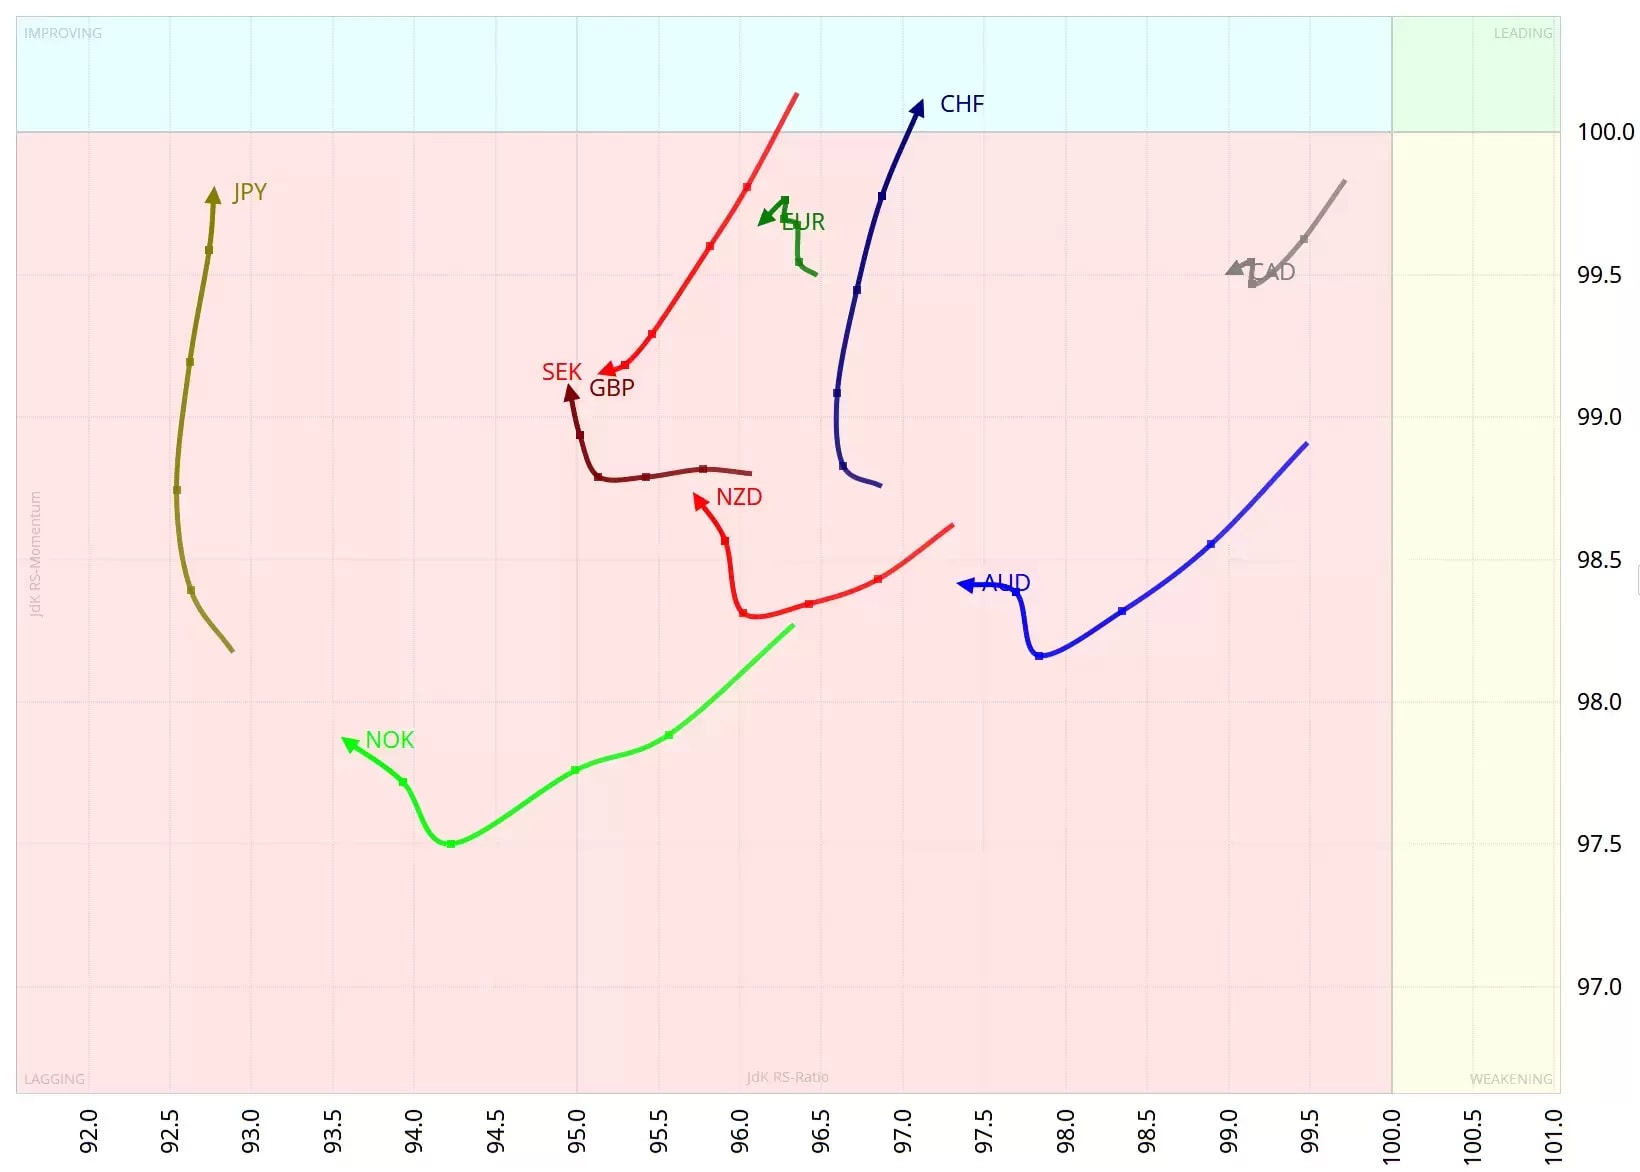
The daily RRG chart picture shows a south-westerly direction in the RRG – a declining JdeK RS-Ratio and JdeK RS-Momentum. Some significant support levels have given way. The exception to this last week was the JPY, but it has now joined the bunch, but still sits lonely in the improving quadrant. The AUD is the one currency not headed south-westerly, but it has merely stalled its position in the lagging quadrant.

We have focused in recent weeks on EUR/USD. Last week we looked at monthly charts going back to 1995, to emphasise that the 1.03 level was so critical. This area had served as support during a few major market turnarounds, most recently in 2015 and 2017. EUR/USD has plunged as we feared, down to 1.03 and now testing parity to the USD. EUR/USD is at multi-decade lows. The monthly MACD crossed down earlier this year, but the gap between the MACD line and its signal line is still widening – indicating increasing downward momentum. This decisive break means that the break lower will open up the way for much more USD strength.
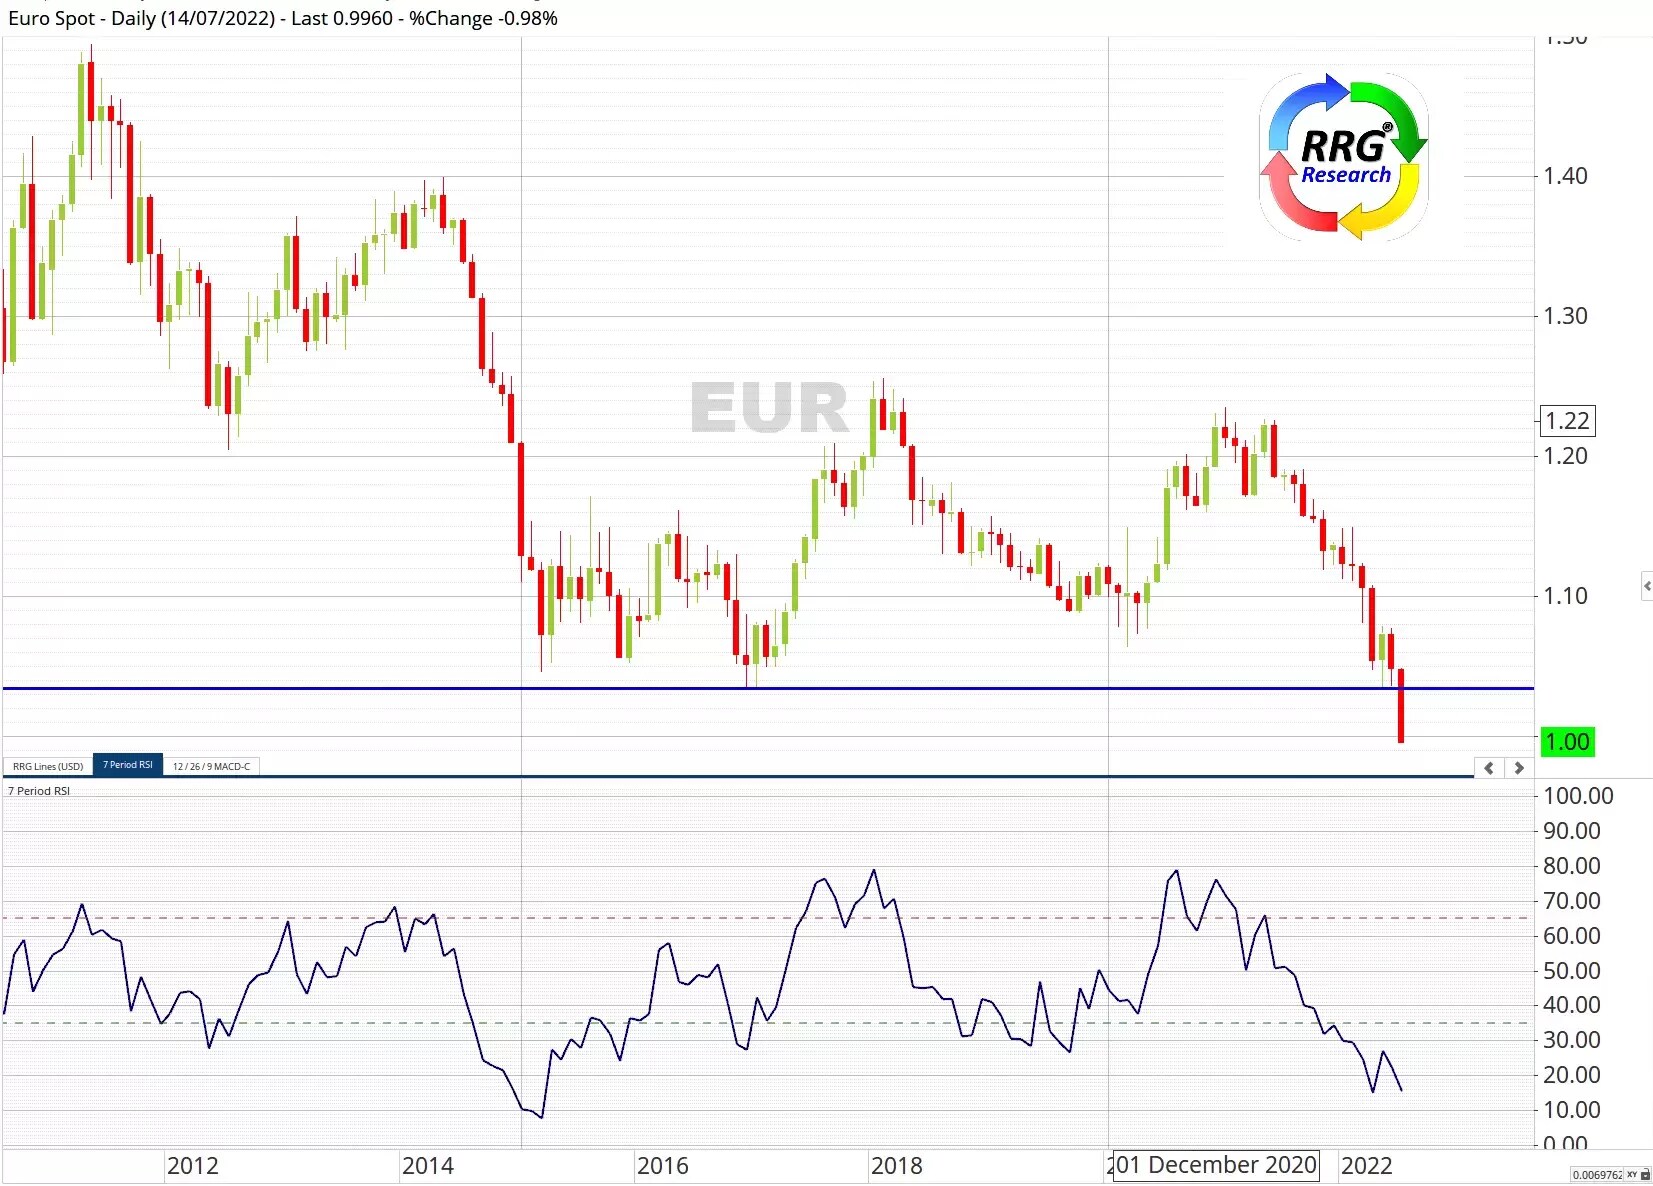
Were next? EUR/USD is trading at the significant psychological support level of parity. The relative strength index (RSI) indicates the EUR is deeply 'oversold'. But this reading is so low because EUR/USD is very weak. This is never a reason on its own to buy something. If the RSI turns up, even better with a 'bullish divergence', there could be an overdue rally. There is a minor consolidation of support at 98 from 2002. Stiff support comes in at 93. Any bounce from here is likely to hit strong resistance at the 1.0 level.
Pricing is indicative. Past performance is not a reliable indicator of future results. RRG’s views and findings are their own and should not be relied upon as the basis of a trading or investment decision.
Disclaimer: CMC Markets is an execution-only service provider. The material (whether or not it states any opinions) is for general information purposes only, and does not take into account your personal circumstances or objectives. Nothing in this material is (or should be considered to be) financial, investment or other advice on which reliance should be placed. No opinion given in the material constitutes a recommendation by CMC Markets or the author that any particular investment, security, transaction or investment strategy is suitable for any specific person. The material has not been prepared in accordance with legal requirements designed to promote the independence of investment research. Although we are not specifically prevented from dealing before providing this material, we do not seek to take advantage of the material prior to its dissemination.


