In my article last week, I picked out some commodities and companies to watch, including gold [GLD], soybeans [SOYB], and aluminium producer Alcoa Corp [AA]. All could benefit from a bullish commodities cycle that emerged in 2020 and may take years to abate. This week, I’d like to follow up on how those picks are performing.
US dollar
The US dollar appears oversold and could bounce. The end-of-day continuous contract chart, below, shows the decline since October. Our Real Motion indicator, a measure of momentum, suggests that we may soon see an uptick as USD reverts to the mean.
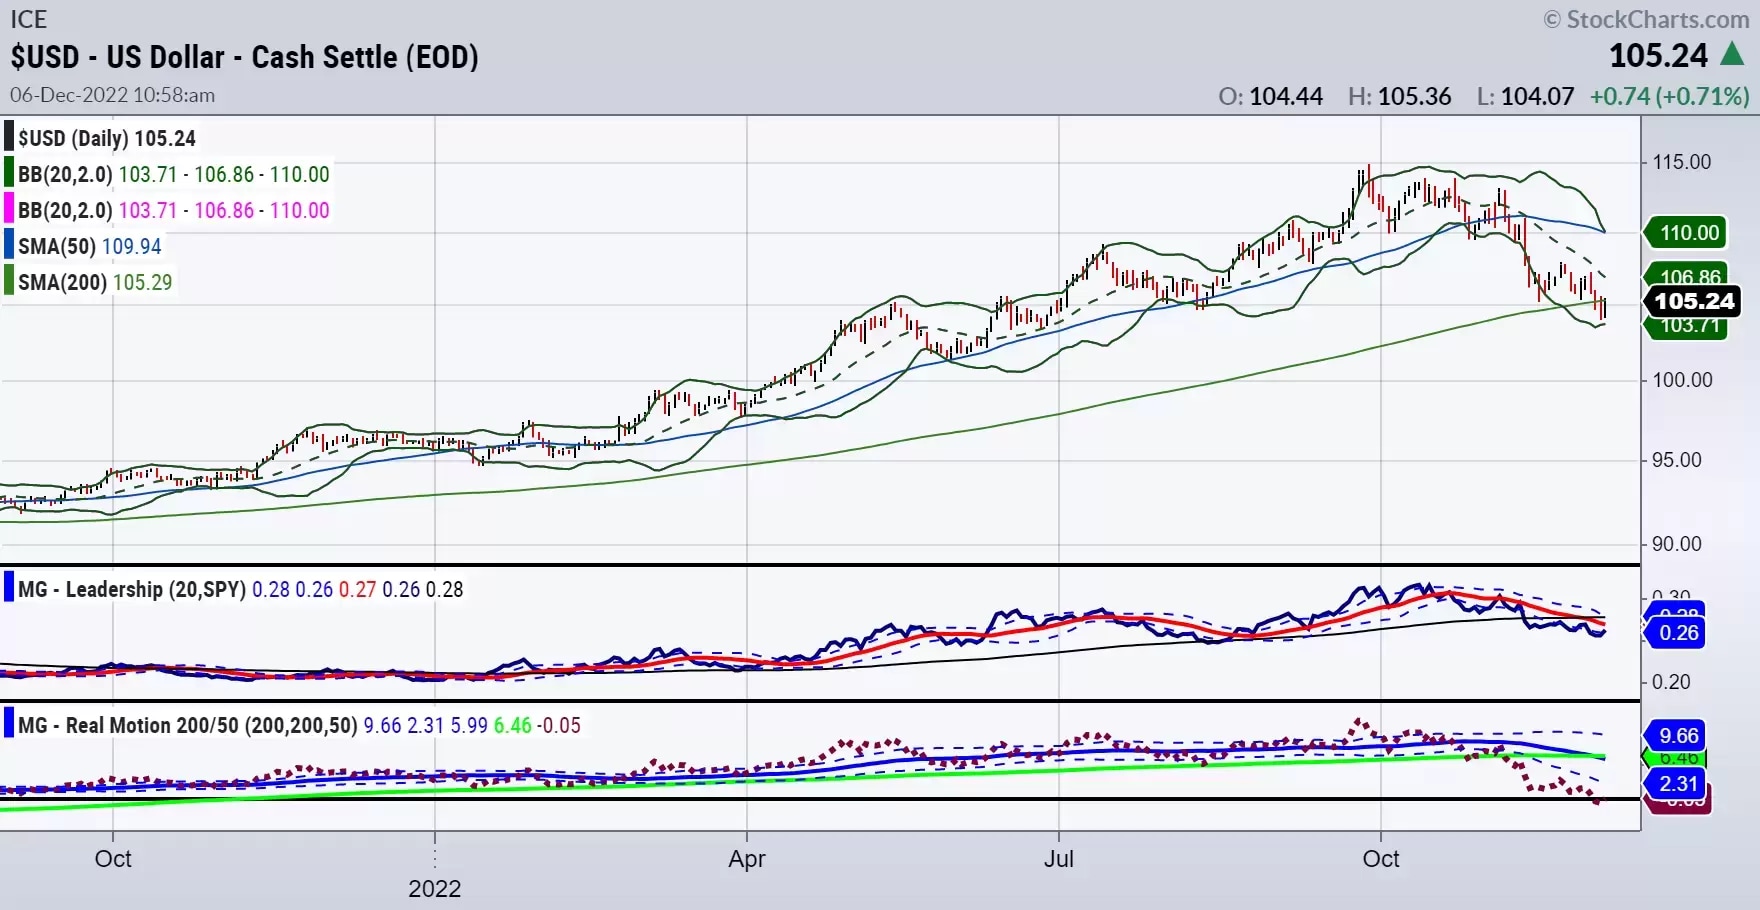
The dollar index made a new 60-plus day low on Monday 5 December. The low of $104.11 is just above the key 50-week moving average.
There are other signs that the dollar could bounce. At the time of writing, Tuesday’s price action suggests that the index may be about to rise up to meet the 200-day moving average (the light green line) at $105.60. The strength and sustainability of the bounce remain to be seen, but the index could head back to around $108 before falling again.
So, what does all this mean for my chosen commodities and stocks? Assuming a dollar bounce, let us take another look at last week’s picks and map out a possible path for the coming weeks.
Gold
On Tuesday 29 November, US gold futures settled 0.5% higher at $1,748.40 per ounce. I wrote that gold “could eventually clear $1,780 and head towards $2,000” and that the SPDR Gold Trust [GLD], an exchange-traded fund (ETF) that tracks the price of the yellow metal, needed to hold support at $159 to $160.
Since then, gold did indeed rise above $1,780 per ounce, topping $1,800 last Thursday. But the price dipped on Friday and fell further on Monday, and now sits just above $1,770.
As for GLD, the ETF shown in the chart below, the aim a week ago was to buy on weakness at around $163 and sell on the failure of the 200-day moving average (DMA) at $167 for a quick gain.
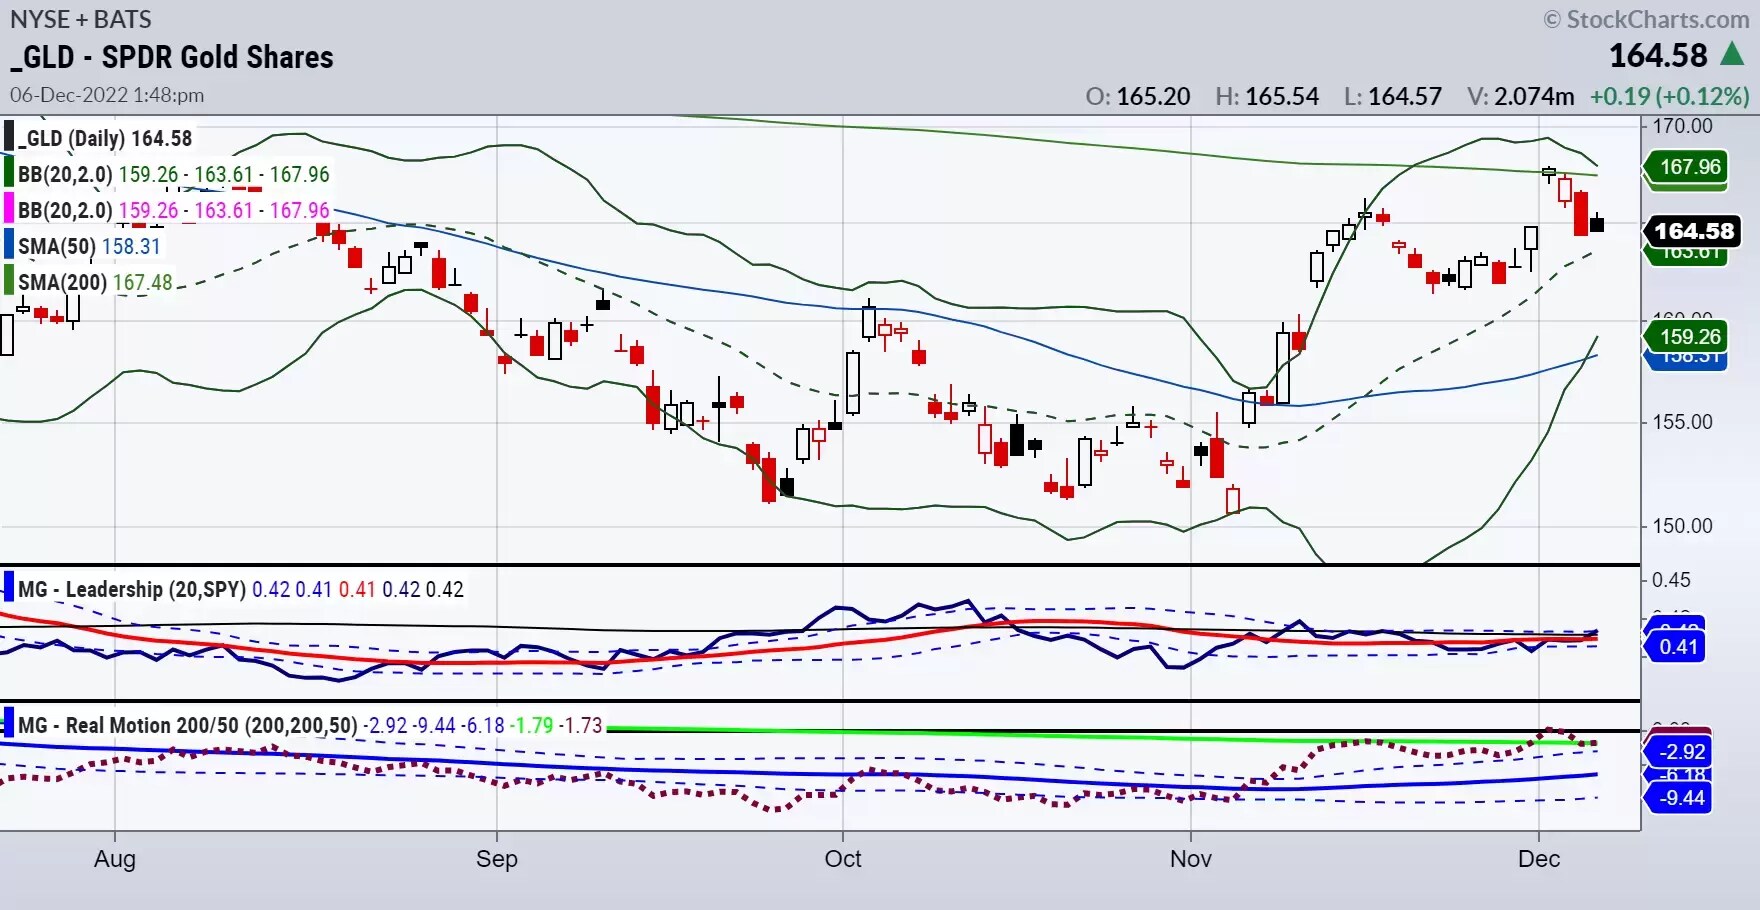
Now, I would want to see further price weakness before re-opening a long position. With GLD continuing to outperform the S&P 500, actively trading fluctuations in gold could be profitable. I continue to regard $159 as a key support level, and see potential for GLD to rise higher in 2023.
Aluminium
As for Alcoa Corp [AA], the largest US aluminium producer, I wrote last week that “$45 [is] a good support level to watch as a risk point. If the stock climbs to $50, it could rise to the first big resistance level at $58”.
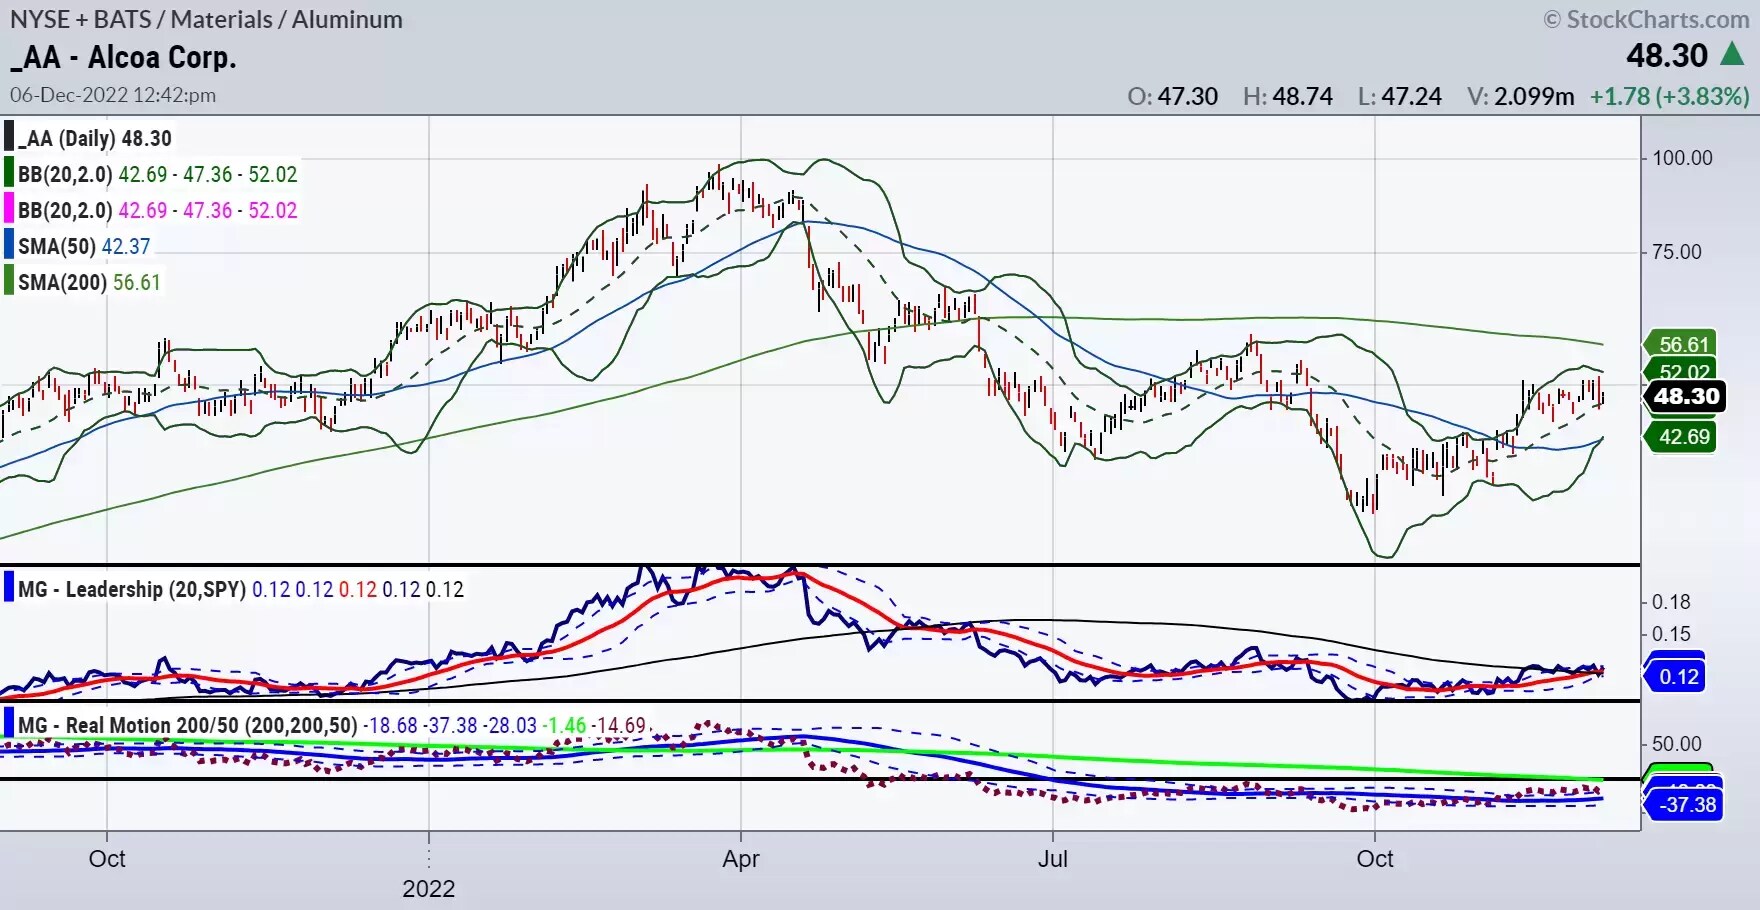
While the stock cleared $50 last Wednesday and topped $51 on Monday, the move was not sustained and the shares closed at $48.31 yesterday. That said, the company’s fundamentals still appear positive over the long term. If the price were to dip closer to $43, that could provide an entry point. If the stock clears $52, a breakout could follow.
Soybeans
Last week I wrote that the Teucrium Soybean Fund ETF [SOYB] showed “resistance in early November at $27.70, with Tuesday’s [29 November] high at $27.72. If the fund clears that level, it could move above the all-time high of $28.22, and possibly up to around $30. The risk is under $26.50”.
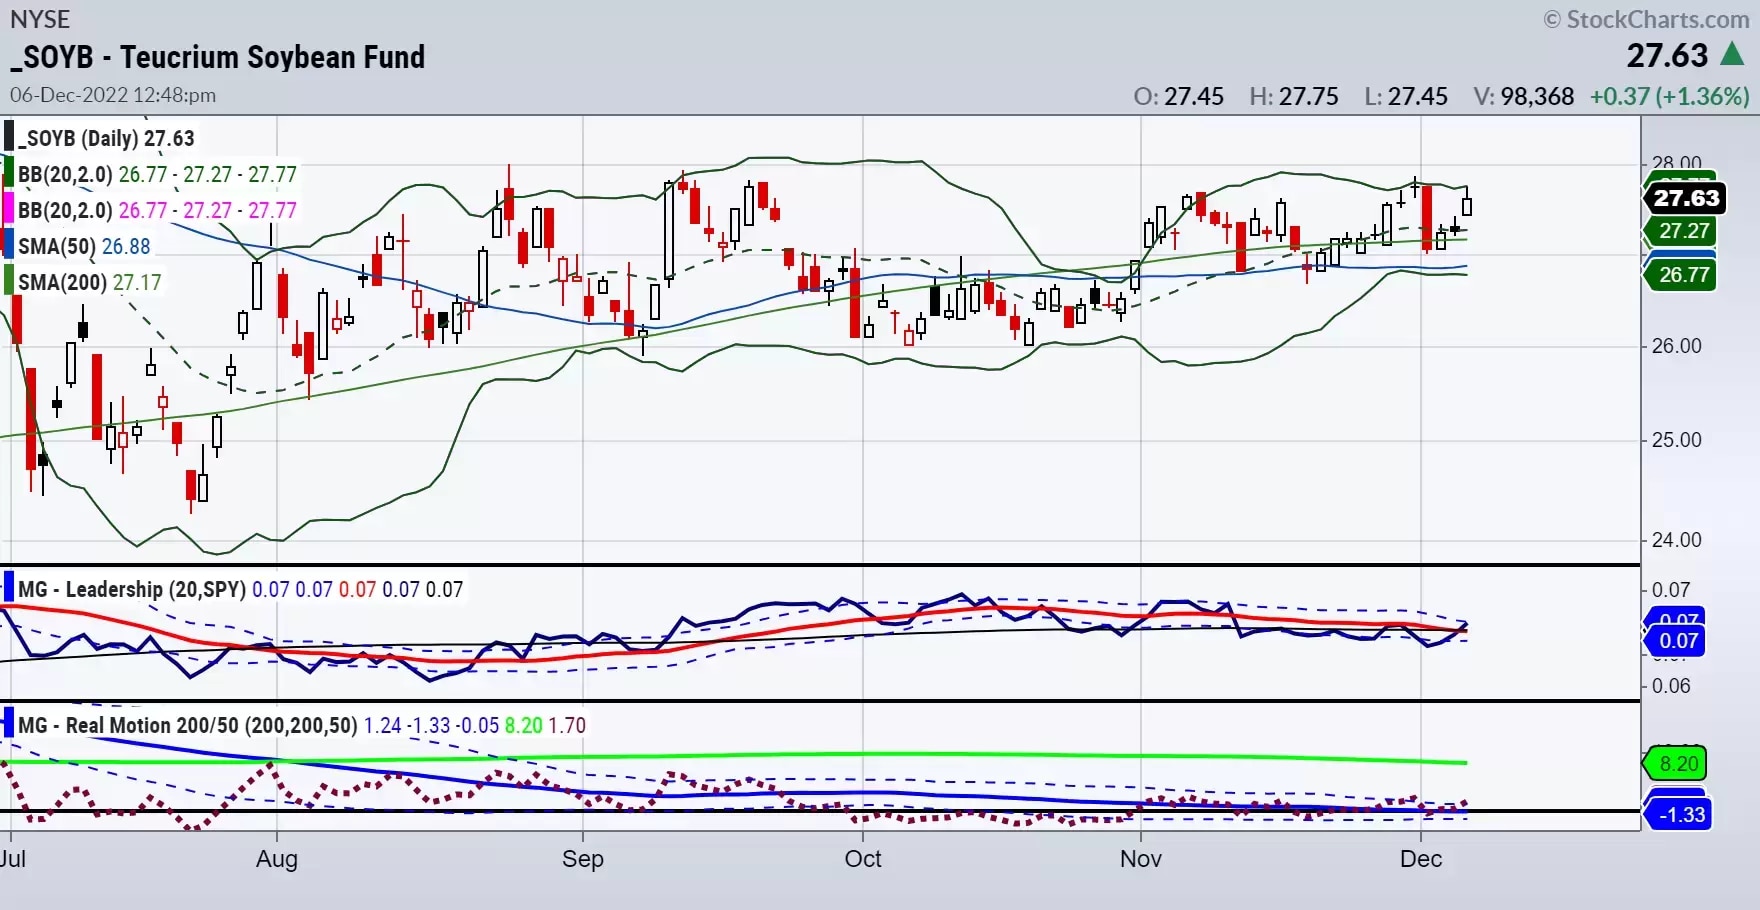
In the past week SOYB has been flat, closing at $27.52 yesterday. However, there may still be potential upside.
Teck Resources
Coal mining and mineral development company Teck Resources [TECK] could rise “to around $45”, I wrote last week. Since then, the stock has risen roughly 4% to close at $36.73 on Tuesday.
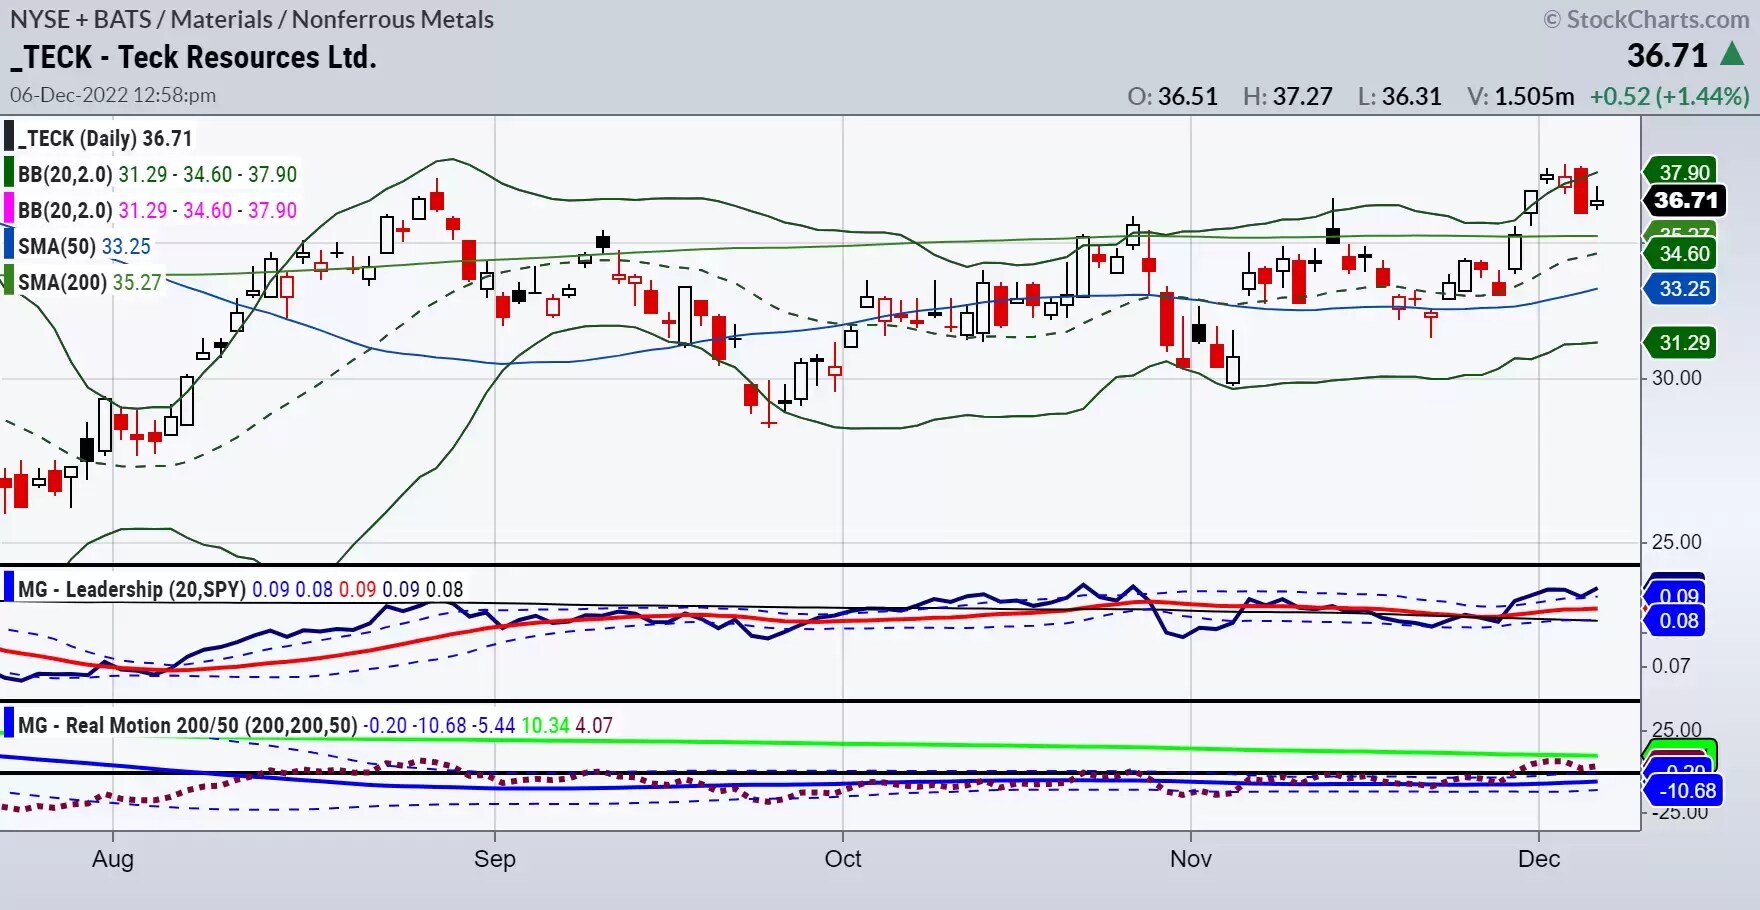
Assuming a long position from yesterday’s closing price, I would become defensive it the price were to break below $35.25. Conversely, it would be a positive sign if the consolidation above the 200-DMA were to continue and take the price up towards my $45 target.
The dollar will be a factor. So, too, will the US Federal Reserve’s mid-December interest rate decision. However, the key takeaway to carry in to next year is that the commodities and stocks discussed above are all displaying positive trends, unlike struggling equity indices.
Mish’s ETF support and resistance levels
S&P 500 (SPY) The 50-week moving average (WMA) looms above as resistance at 410; until that clears, SPY could return to support at the 50-DMA or 380
Russell 2000 (IWM) 190 resistance; support at 177 must hold
Dow (DIA) Above its 50-WMA; support at 329 could be interesting
Nasdaq (QQQ) Still the weakest index; unless it holds major support at 278, could be heading for trouble
Regional banks (KRE) After weeks of sideways action, KRE failed with last major support at 57
Semiconductors (SMH) 212 support to hold; if this can lead, 230 is the level to clear
Transportation (IYT) Another one to fail its 50-WMA; 213-214 now key support
Biotechnology (IBB) “Do not chase breakouts” has been a theme this year; above its 50-WMA, let’s see if IBB holds 127
Retail (XRT) Never cleared 67; now 63 is major support
Mish Schneider is MarketGauge’s director of trading education and research. Read more of MarketGauge’s market analysis here, and subscribe to their YouTube channel here. Mish Schneider's and MarketGauge's views and findings are their own, and should not be relied upon as the basis of a trading or investment decision. Pricing is indicative. Past performance is not a reliable indicator of future results.
Disclaimer: CMC Markets is an execution-only service provider. The material (whether or not it states any opinions) is for general information purposes only, and does not take into account your personal circumstances or objectives. Nothing in this material is (or should be considered to be) financial, investment or other advice on which reliance should be placed. No opinion given in the material constitutes a recommendation by CMC Markets or the author that any particular investment, security, transaction or investment strategy is suitable for any specific person. The material has not been prepared in accordance with legal requirements designed to promote the independence of investment research. Although we are not specifically prevented from dealing before providing this material, we do not seek to take advantage of the material prior to its dissemination.


