Module linking explained

4 minute read
|9 Apr 2024
Module linking explained
Table of contents
  • 1.
    Example
  • 2.
    Linking charts

The majority of modules within the Next Generation web platform, for example watchlists, charts, client sentiment, Reuters news and order tickets, can be linked together to make navigating the platform features easier and more efficient. 

When two or more modules are linked together, changing the product in one will automatically change the product shown in the others.

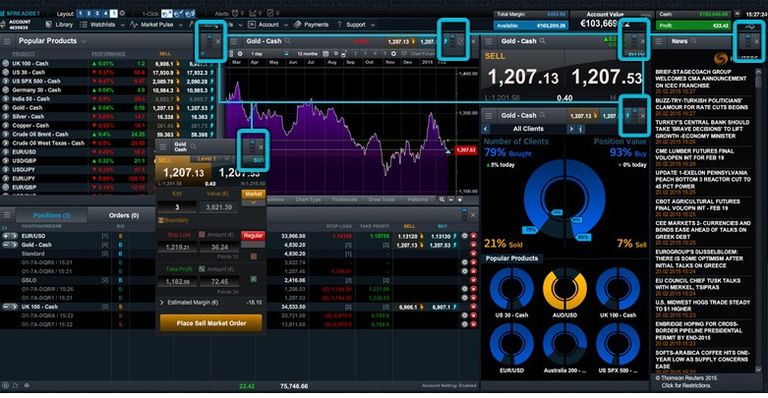
The linking option and indicator will appear in the top right of the module if available. Simply click one of the four boxes, representing four different colors, to include that module within a group.

If linking is available on that module, you can edit linked groups by selecting/deselecting colors in the module header, or via an additional option within the module's context menu.

Example

The layout below shows the watchlist, chart, client sentiment, Reuters news, and order ticket all linked together as a 'blue group', and the current product displayed is Gold. To change this to EUR/USD, simply click the EUR/USD product name in the watchlist, and the platform will update all of the linked modules to show the new product.

Note: You can also click on the product name within the product library and positions screen to change the group's product.

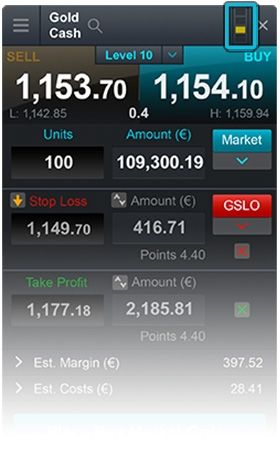
You can also change the product displayed within a module or linked group by using the search icon in the headers of the modules.

Linking charts

When module linking is applied to charts, there are a few rules to be aware of:

1. You can link multiple charts to the same group:

  • If you link an existing chart to a group containing another chart, the product in the added chart will be updated to match the group's product. There can only be one product displayed per linked group.

  • All technicals, drawing tools, and settings from the current group will be applied to the newly linked chart. However, the interval of the new linked chart remains the same, allowing you to view multiple time intervals quickly and easily.

  • Almost all functions applied or changed on one chart within the group will automatically appear within the other linked charts, including drawing tools, technicals, chart type, patterns, presets, crosshair, dynamic line, and advanced settings. Previous functions will be cleared. There are a few exceptions, including time interval, timeframe, reset view, hide/show drawing tools, and trade plots.

2. Charts linked to a watchlist will automatically load the saved chart containing your previous analysis, if one is available.

CFD Module Linking Small

Learn how you can group different platform features together, so that when you update the product you want to look at, all the other features you've linked will also update.

This feature enables you to group different modules, allowing changes in one module to automatically update all others in the same group. You can link watchlists to Reuters news, client sentiment, charts, and order tickets for efficient analysis and trading of your preferred products.

Most modules in the Next Generation platform, such as the watchlist, charts, client sentiment, Reuters news, and the order ticket, can be linked together, streamlining platform navigation and product analysis.

When two or more modules are linked, changing the product in one will automatically update the others. The linking option and indicator appear in the top right of the module. Click one of the four colored boxes representing different groups to include that module in a specific group. Alternatively, link a module using the context menu.

Here's an example: In this layout, the watchlist, chart, client sentiment, Reuters news, and order ticket are linked to the blue group. Currently, the displayed product is gold. To change it, click on the product name in the watchlist and select Euro/Dollar. All modules will update to display the new product.

CFD Module Linking

You can also update the group's product by clicking on the product name in the product library or position screen. Additionally, use the search icon in many module headers to change the product shown within a group.

When linking charts to a group, note that selecting a product from the watchlist will display your saved chart, if available. To open a default chart, use the product's context menu.

You can link multiple charts to one group, but each linked chart will display the existing product in the group. All technicals, drawing tools, and settings from the current group will be carried over to the newly linked chart.

Almost all functions added or changed on one chart within the group will appear in the other linked charts, including drawing tools, technicals, chart type, patterns, presets, crosshair, dynamic line, and advanced settings. Exceptions include time interval, timeframe, reset view, hide/show drawing tools, and trade plots. You can view multiple time intervals for the same product easily with key technicals and drawing tools displayed across them all. The platform automatically saves your analysis if the product was opened via the watchlist.

Join over 1,000,000 clients on our award-winning trading platform
Practise trading with $10,000 of virtual funds on a risk-free demo account.
Access 12,000+ instruments on our award-winning Next Generation platform. Including indices, forex and shares.
Enhance your trading on MetaTrader4 with CMC Markets and access 175+ forex pairs.
No hidden fees, tight spreads and low margin rates.