Chart patterns are an important trading tool that should be used as part of your technical analysis strategy. From beginners to professionals, chart patterns play an integral part when looking for market trends and predicting movements. They can be used to analyse all markets, including forex, shares, commodities, and more.
The following chart patterns are the most recognisable and common chart patterns to look out for when using technical analysis to trade the financial markets. Our guide to the most important stock chart trading patterns can be applied to most financial markets, and this could be a good way to start your technical analysis.
Key patterns to watch
1. Ascending triangle
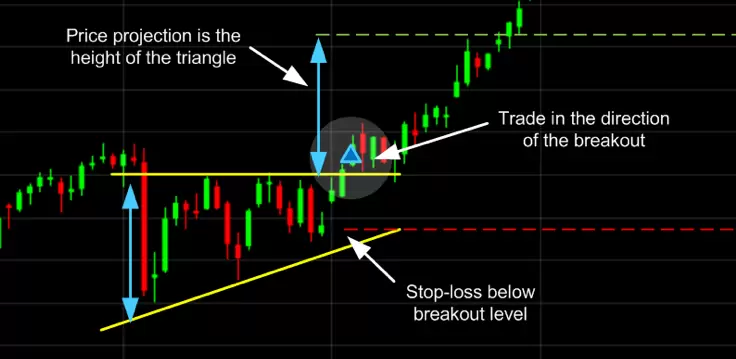
The ascending triangle is a bullish ‘continuation’ chart pattern that signifies a breakout is likely where the triangle lines converge. To draw this pattern, you need to place a horizontal line (the resistance line) on the resistance points and draw an ascending line (the uptrend line) along the support points.

