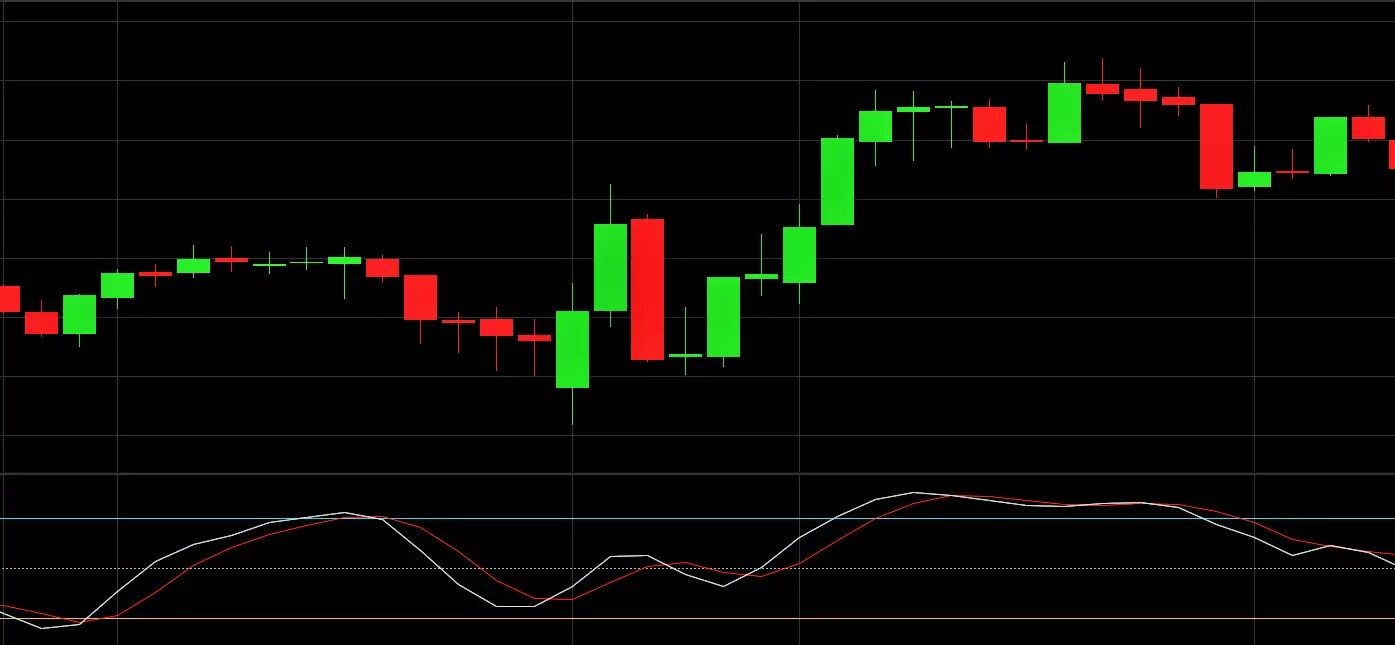
How to use the stochastic oscillator
Stochastic overbought/oversold strategy
In a basic overbought/oversold strategy, traders can use the stochastic indicator to identify trade exit and entry points.
Generally, traders look to place a buy trade when an instrument is oversold. A buy signal is often given when the stochastic indicator has been below 20 and then rises above 20. In contrast, traders look to place a sell trade when an instrument is overbought. A sell signal is often given when the stochastic indicator has been above 80 and then falls below 80.
However, overbought and oversold labels can be misleading. An instrument won’t necessarily fall in price just because it is overbought. Similarly, an instrument won’t automatically rise in price just because it is oversold. Overbought and oversold simply mean the price is trading near the top or bottom of the range. These conditions can last for a while.
Stochastic divergence strategy
Another popular trading strategy using the stochastic indicator is a divergence strategy. In this strategy, traders will look to see if an instrument’s price is making new highs or lows, while the stochastic indicator isn’t. This can signal that the trend may be about to reverse.
A bullish divergence occurs when an instrument’s price makes a lower low, but the stochastic indicator touches a higher low. This signals that selling pressure has decreased and a reversal upwards could be about to occur. A bearish divergence occurs when an instrument’s price makes a higher high, but the stochastic indicator hits a lower high. This signals that upward momentum has slowed and a reversal downward could be about to take place.
An important point in relation to the divergence strategy is that trades should not be made until divergence is confirmed by an actual turnaround in the price. An instrument’s price can continue to rise or fall for a long time, even while divergence is occurring.
Stochastic crossover
The stochastic crossover is another popular strategy used by traders. This occurs when the two lines cross in an overbought or oversold region.
When an increasing %K line crosses above the %D line in an oversold region, it is generating a buy signal. When a decreasing %K line crosses below the %D line in an overbought region, this is a sell signal. These signals tend to be more reliable in a range-bound market. They are less reliable in a trending market.
In a trend-following strategy, traders will monitor the stochastic indicator to ensure that it stays crossed in one direction. This shows that the trend is still valid.
Stochastic bull/bear strategy
Lastly, another popular use of the stochastic indicator is identifying bull and bear trade setups. A bull trade setup occurs when the stochastic indicator makes a higher high, but the instrument’s price makes a lower high. This indicates that momentum is increasing and the instrument’s price could move higher. Traders often look to buy after a brief price pullback in which the stochastic indicator has dropped below 50 on the pullback and then moved higher again. A bear trade setup occurs when the stochastic indicator makes a lower low, but the instrument’s price makes a higher low. This signals that selling pressure is increasing and the instrument’s price could move lower. Traders often look to place a sell trade after a brief rebound in the price.
Traders should be aware that the stochastic indicator does have limitations. It is not a foolproof technical analysis tool. The indicator can often generate false signals. During choppy market conditions, this can happen frequently.

