11 significant stock chart patterns

6 minute read
|13 Mar 2025
Close-up of a wave formed by intertwining colored lines, showcasing a spectrum of hues and fluid motion forming a chart.
Table of contents
  • 1.
    Is it possible to trade for a living?
  • 2.
    How to easily recognise chart patterns
  • 3.
    Can I use a stock pattern screener?
  • 4.
    What else do you need to know before trading?
  • 5.
    Steps to getting started on our platform
  • 6.
    Try our stock chart patterns app

Stock chart patterns are an important trading tool that should be used as part of your technical analysis strategy. From beginners to professionals, chart patterns play an integral part when looking for market trends and predicting movements. They can be used to analyse all markets, including forex, shares, commodities, and more.

The following stock chart patterns are the most recognisable and common chart patterns to look out for when using technical analysis to trade the financial markets. Our guide to the most important stock chart trading patterns can be applied to most financial markets, and this could be a good way to start your technical analysis.

KEY POINTS

  • Patterns may help to suggest in which direction prices are headed based on previous movements 

  • They’re most effective on candlestick charts, as you can see previous open and close prices 

  • There is a great variety of chart patterns, including wedges, triangles, cup and handles, head and shoulders, and flags 

  • Stock pattern screeners make it easier to spot them on charts 

  • A basic knowledge of support and resistance will help identify technical patterns.

Is it possible to trade for a living?

It is possible to make money trading, but it comes with many risks and extra costs that must be taken into consideration. Consult our section on ‘What else do you need to know’ before opening a potentially risky trade. After all, not all positions will end in profit.

To see whether you could make money from trading CFDs, you could try out our risk-free demo account, which allows you to practice first using $10,000 of virtual funds. Once you feel confident enough to enter the live markets using real funds, you can then switch to a live account.

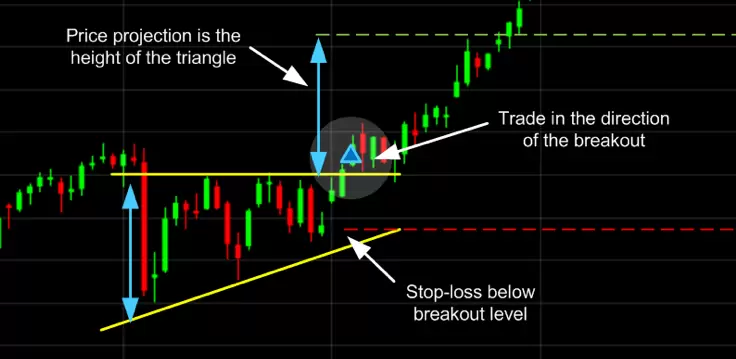
1. Ascending triangle

The ascending triangle is a bullish ‘continuation’ chart pattern that signifies a breakout is likely where the triangle lines converge. To draw this pattern, you need to place a horizontal line (the resistance line) on the resistance points and draw an ascending line (the uptrend line) along the support points.

Price projection is the height of the triangle

2. Descending triangle

Unlike ascending triangles, the descending triangle represents a bearish market downtrend. The support line is horizontal, and the resistance line is descending, signifying the possibility of a downward breakout.

Descending triangle

3. Symmetrical triangle

For symmetrical triangles, two trend lines start to meet which signifies a breakout in either direction. The support line is drawn with an upward trend, and the resistance line is drawn with a downward trend. Even though the breakout can happen in either direction, it often follows the general trend of the market.

Symmetrical triangle

4. Pennant

Pennants are represented by two lines that meet at a set point. They are often formed after strong upward or downward moves where traders pause and the price consolidates, before the trend continues in the same direction.

Pennant

5. Flag

The flag stock chart pattern is shaped as a sloping rectangle, where the support and resistance lines run parallel until there is a breakout. The breakout is usually the opposite direction of the trendlines, meaning this is a reversal pattern.

Flag

6. Wedge

A wedge pattern​ represents a tightening price movement between the support and resistance lines, this can be either a rising wedge or a falling wedge. Unlike the triangle, the wedge doesn’t have a horizontal trend line and is characterised by either two upward trend lines or two downward trend lines.

For a downward wedge, it is thought that the price will break through the resistance and for an upward wedge, the price is hypothesised to break through the support. This means the wedge is a reversal pattern as the breakout is opposite to the general trend.

Wedge

7. Double bottom

A double bottom looks similar to the letter W and indicates when the price has made two unsuccessful attempts at breaking through the support level. It is a reversal chart pattern as it highlights a trend reversal. After unsuccessfully breaking through the support twice, the market price shifts towards an uptrend.

Double bottom

8. Double top

Opposite to a double bottom, a double top looks much like the letter M. The trend enters a reversal phase after failing to break through the resistance level twice. The trend then follows back to the support threshold and starts a downward trend breaking through the support line.

Double top

9. Head and shoulders

The head and shoulders pattern​ tries to predict a bull to bear market reversal. Characterised by a large peak with two smaller peaks either side, all three levels fall back to the same support level. The trend is then likely to breakout in a downward motion.

Head and shoulders

10. Rounding top or bottom

A rounding bottom or cup usually indicates a bullish upward trend, whereas a rounding top usually indicates a bearish downward trend. Traders can buy at the middle of the U shape, capitalising on the trend that follows as it breaks through the resistance levels.

Rounding top or bottom

11. Cup and handle

The cup and handle​ is a well-known continuation stock chart pattern that signals a bullish market trend. It is the same as the above rounding bottom, but features a handle after the rounding bottom. The handle resembles a flag or pennant, and once completed, you can see the market breakout in a bullish upwards trend.

Cup and handle

How to easily recognise chart patterns

Chart patterns can sometimes be quite difficult to identify on trading charts when you’re a beginner and even when you’re a professional trader. Using popular patterns such as triangles, wedges and channels, coupled with our bespoke star rating system, we have a tool that updates every 15 minutes to continuously highlight potential emerging and completed technical trade set-ups. You can also apply stock chart patterns manually on your trading charts as part of our drawing tools collection.

Trading chart patterns often form shapes, which can help predetermine price action​​, such as stock breakouts and reversals. Recognising chart patterns will help you gain a competitive advantage in the market, and using them will increase the value of your future technical analyses. Before starting your chart pattern analysis, it is important to familiarise yourself with the different types of trading charts​​.

Can I use a stock pattern screener?

Luckily, we have integrated our pattern recognition scanner as part of our innovative Next Generation trading platform​. Our pattern recognition scanner​​ helps identify chart patterns automatically, saving you time and effort. The pattern recognition software collates data from our most popular products and alerts you to potential technical trading opportunities across multiple time intervals. Alternatively, see a list of well-known and effective stock screeners​ in this article.

What else do you need to know before trading?

Trading on the financial markets can be a daunting process, especially for a beginner, so it may be a good idea to brush up your knowledge on the following things beforehand:

  • Costs​ (including margin rates, overnight fees, commissions)

  • The risk that your chosen market or instrument presents

  • How to prevent margin calls and account close-outs

  • Risk-management tools indicators and market data can help with every trade.

Steps to getting started on our platform

So, if you’re ready to get started trading CFDs on our platform, follow the simple steps below to sign up for an account. 

  1. Open a trading account to access our product library. You’ll be able to practice first using $10,000 of virtual funds on our risk-free demo account.

  1. With a demo, you can access financial markets, such as commodities, forex, indices, and treasuries, for an unlimited period of time, as well as one month of free access to shares and ETFs.

  1. Deposit funds to open your live account and access unlimited instruments. Your subscription will also include exclusive market data, Morningstar reports and a Reuters news feed.

Try our stock chart patterns app

Our online trading platform is also available on mobile and tablet devices, thanks to advancements in technology. Learn more about our mobile trading applications​​ and how you can browse stock chart patterns through our app when trading on-the-go. This is available for both Android and iOS software.

Stock Chart Pattern
Frequently asked questions

What are stock chart patterns?

Stock chart patterns are lines and shapes drawn onto price charts to help predict forthcoming price actions, such as breakouts and reversals. They are a fundamental technical analysis technique that helps traders use past price actions as a guide for potential future market movements

How do stock chart patterns work?

Chart patterns work by representing the market’s supply and demand. This causes the trend to move in a certain way on a trading chart, forming a pattern. However, chart pattern movements are not guaranteed and should be used alongside other methods of market analysis. Chart patterns can be identified on our chart pattern screener​ tool

What chart patterns are common in forex?

The head and shoulders chart pattern and the triangle chart pattern are two of the most common patterns for forex traders. They occur more regularly than other patterns and provide a simple basis for further analysis and decision-making. Try a demo account to practice your chart pattern recognition. 

How many types of chart patterns are there?

There are three key chart patterns used by technical analysis experts. These are traditional chart patterns, harmonic patterns​ and candlestick patterns (which can only be identified on candlestick charts). See our list of essential trading patterns to get your technical analysis started. 

What are reversal and continuation patterns?

When a price signal changes direction, it is a reversal pattern. However, when a price trend continues in the same direction it is a continuation pattern. Technical analysts have long used chart patterns as a method for forecasting price movements and trend reversals. You can use our pattern recognition software​ to help inform your analysis. 

Join an award winning CFD provider
Practise trading with $10,000 of virtual funds on a risk-free demo account.
Access 12,000+ instruments on our award-winning Next Generation platform. Including indices, forex and shares.
Enhance your trading on MetaTrader4 with CMC Markets and access 175+ forex pairs.
Tight spreads and low margin rates.