Standardiserad riskvarning: CFD-kontrakt är komplexa instrument som innebär stor risk för snabba förluster på grund av hävstången. 72 procent av alla icke-professionella kunder förlorar pengar på CFD-handel hos den här leverantören. Du bör tänka efter om du förstår hur CFD-kontrakt fungerar och om du har råd med den stora risk som finns för att du kommer att förlora dina pengar.

Share price insight from Morningstar

Morningstar quantitative equity research reports* are available across most of our global CFD share products. Usually updated every 24 hours, the reports can be accessed directly from the Next Generation platform.

En plattform gjord för CFD-handel

Låga spreadar, inga dolda kostnader, tillgång till över 12 000 instrument och mer.

Inkluderar 100 000 fiktiva kronor
IMG LEARNARTICLE TOPRIGHTIMAGE@2X


The research includes all the current cash fundamentals for a share, along with a series of value estimates, to reveal what the share could be worth versus its current underlying price. These value estimates are determined using Morningstar's proprietary calculations and metrics.

The quantitative equity research provided in the Morningstar reports is automated and uses a universal rule-based metric system to generate all its value estimates. This feature doesn't offer tailored investment advice or personal analysis; it does however provide a simple yet effective summary of the latest data releases impacting each share, and applies the same value logic to each one.

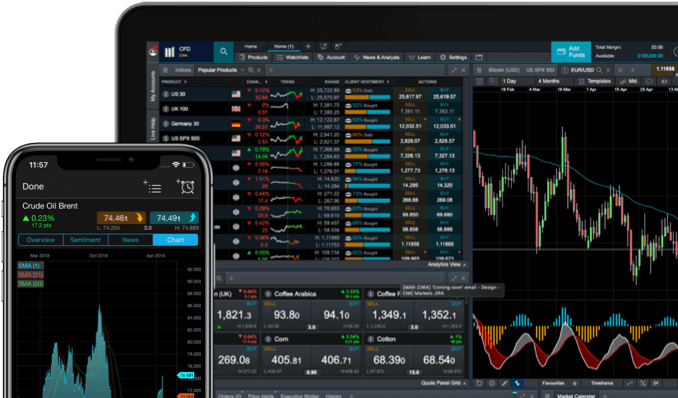
You can access the Morningstar quantitative equity research reports via the product dropdown menus in the trading platform. This feature is also available on our mobile trading apps.

An example report

  • A: The quantitative fair value estimate is the core component of the report and provides an estimate of what the value of the share could be.
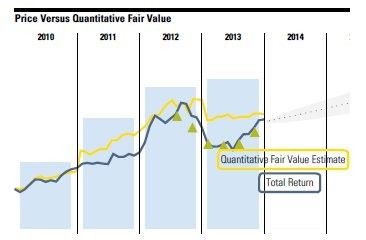
  • B: The underlying historical price versus the quantitative fair value estimates.
  • C: The forecasted price range, based on the previous relationship between the quantitative fair value estimate and the underlying price.
  • D: Valuation data, including price/earnings ratio, cash flow and dividend yield.
  • E: Historical financials, including revenue, income, cash flow, earnings per share and overall profitability.
  • F: Competitive advantage trend chart, calculated using the quantitative moat ratings.
Effektiv handel överallt

Vill du hantera farten? Vår prisbelönte tradingapp* kan öppnas och låsas, sätta upp varslingar och göra analysatorer med mobiloptimerade diagram och mer.

Quantitative approach

The quantitative equity rating section can be broken into five segments — the quantitative fair value estimate, quantitative economic moat, quantitative valuation, quantitative uncertainty and quantitative financial health. The quantitative metrics used to determine these scores are derived from a statistical model designed to mimic traditional analyst-driven ratings.

Quantitative fair value estimate

The quantitative fair value estimate is Morningstar's estimate of what the share price could be today. This is one of the most useful numbers on the report as it indicates whether the share may currently be undervalued or overvalued. For example, the underlying price of BHP Billiton might currently be 1550.0, while the Morningstar fair value estimate might be 2000.0. The figure is calculated using a statistical model similar to the that Morningstar equity analysts apply to companies.
Quantitative valuation

The quantitative valuation is the ratio of a stock's quantitative fair value estimate to its most recent close price. The rating is expressed as overvalued, fairly valued or undervalued.

Quantitative economic moat

The quantitative economic moat describes the strength of a company's competitive position. The quantitative rating is expressed as none, narrow or wide.

Quantitative uncertainty

Any equity valuation involves a certain degree of uncertainty. The quantitative uncertainty score shows Morningstar's level of uncertainty about the accuracy of the quantitative fair value estimate. The lower the quantitative uncertainty, the more reliable the fair value estimate for that particular company is likely to be. The rating is expressed as low, medium, high, very high or extreme.

Quantitative financial health

Morningstar's quantitative financial health rating reflects the likelihood that a company will face financial problems in the near future. This calculation uses a predictive model designed to anticipate when a company may default on its financial obligations. Financial health is expressed as weak, moderate or strong.

Learn more about shares CFD trading with us.

*These reports are provided by Morningstar for general information only and are not intended to provide investment advice. Neither CMC Markets nor Morningstar is responsible for any trading decisions, damages or losses related to the information or its use.
CMC Markets erbjuder sin tjänst som ”execution only”. Detta material (antingen uttryckt eller inte) är endast för allmän information och tar inte hänsyn till dina personliga omständigheter eller mål. Ingenting i detta material är (eller bör anses vara) finansiella, investeringar eller andra råd som beroende bör läggas på. Inget yttrande i materialet utgör en rekommendation från CMC Markets eller författaren om en viss investering, säkerhet, transaktion eller investeringsstrategi. Detta innehåll har inte skapats i enlighet med de regler som finns för oberoende investeringsrådgivning. Även om vi inte uttryckligen hindras från att handla innan vi har tillhandhållit detta innehåll försöker vi inte dra nytta av det innan det sprids.

Hello, we noticed that you’re in the UK.

The content on this page is not intended for UK customers. Please visit our UK website.

Go to UK site

Innan du lämnar...

Testa CFD-handel på ett kostnadsfritt demokonto. Få tillgång till vår innovativa handelsplattform och testa din tradingstrategi med 100 000 fiktiva kronor.

cmc-mobile-trading-app