CFD Trading Platform - Charting features

3 minute read
|10 Apr 2024
CFD Charting
Table of contents
  • 1.
    Technical analysis
  • 2.
    Volume on charts
  • 3.
    Price Projection
  • 4.
    Module linking
  • 5.
    Chart forum community
  • 6.
    Mobile charting

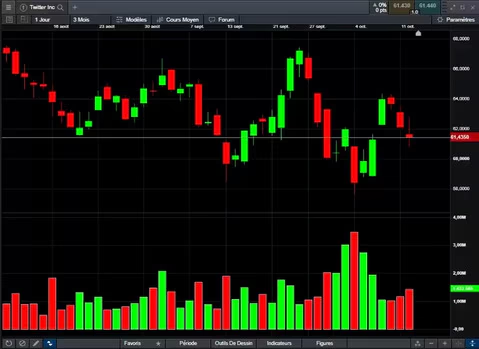
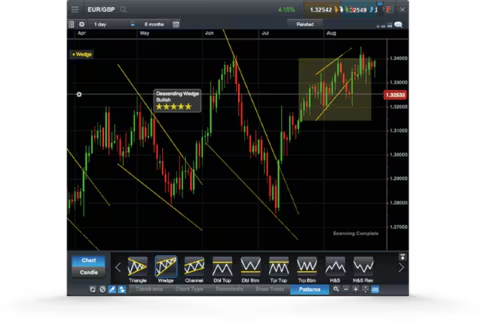
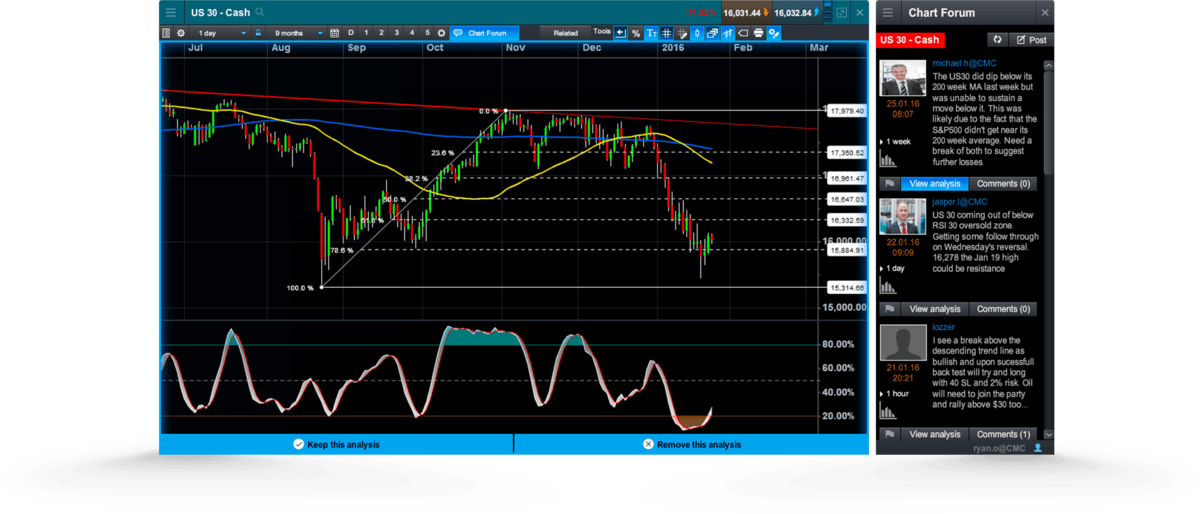
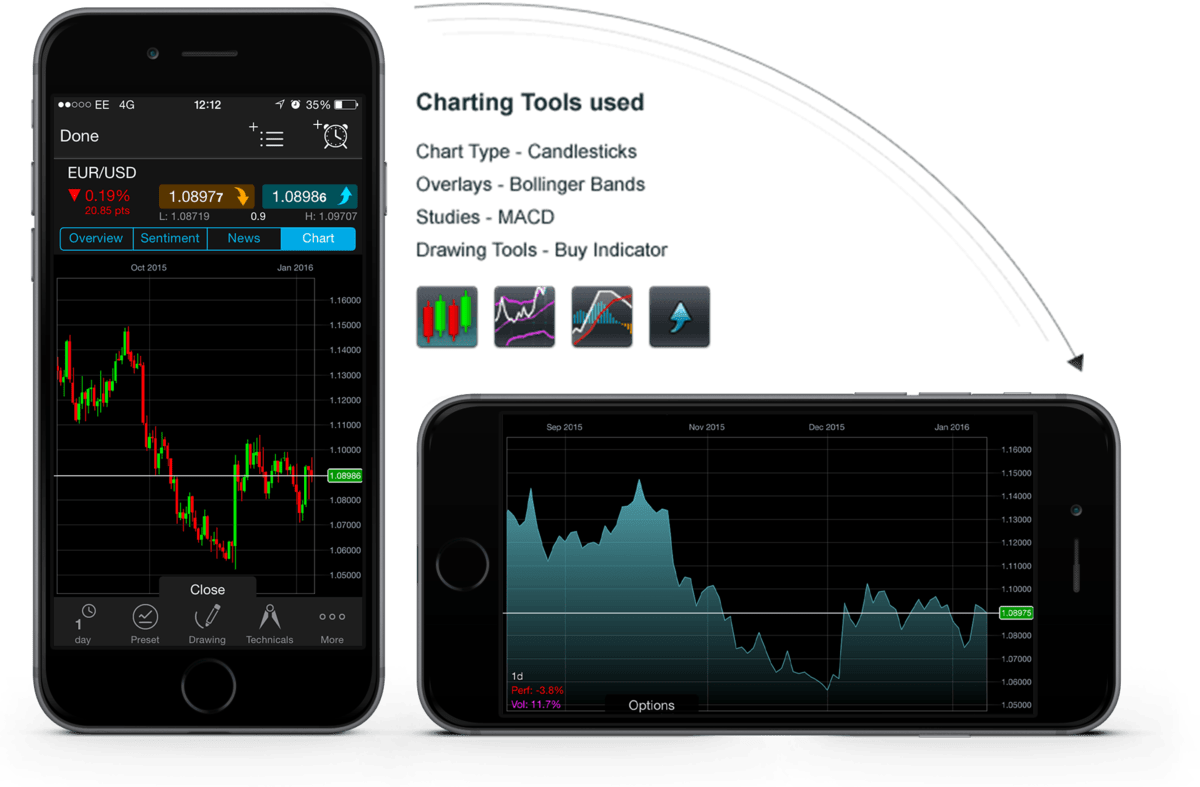
Our award-winning charts provide a host of features to support your chart analysis, including multiple chart types, over 115 technical indicators and drawing tools, a pattern recognition feature and our chart forum community.

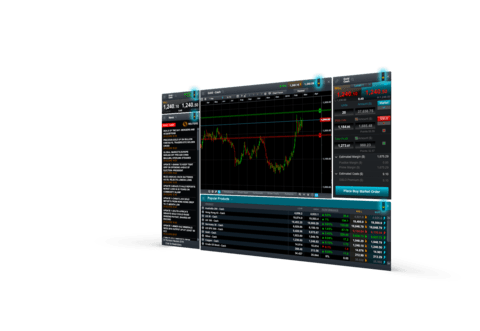
In this video we take you through the charting function of the Next Generation trading platform.

Technical analysis

Our fully-integrated technical analysis suite has been developed in-house and incorporated into our award-winning charting package, to deliver all the tools you need to analyse the financial markets. View our range of chart types available on the CMC Markets Next Generation CFD trading platform.

Range of chart types

Our charting package includes 12 different chart types, including the popular line, OHLC and candlestick charts, plus more advanced charts such as kagi, line break and renko charts.

Over 35 drawing tools

All charts come with over 35 drawing tools that can be used to draw support and resistance levels, make notes on charts and highlight key price moves and patterns.

Technical indicators

Identify trend reversals, significant price levels and trading opportunities. Choose from more than 30 overlays and 50 studies including Bollinger Bands®, SMAs, ichimoku clouds, MACD, RSI and many more.

Extensive price history

Charts for our major products cover as much as 20 years' worth of price history, allowing you to analyse price performance over the long term, as well as the short.

Numerous chart intervals

You can quickly switch between chart intervals, which range from one second through to one month.

Customisable charts

Our layouts, charts and technical indicators are all customisable, offering you the ability to set up your charts and technical analysis exactly as you like.

Compare price action

Identify correlated products by dragging and dropping one or more products on to another product's open chart to compare their performance over the same timeframe.

Save default chart layouts

Once you've customised a chart, save the setup as default so each time you load a new chart the same preferences are applied to it. Save up to five charts per instrument.

Trade from charts

Open trades directly from charts as opportunities emerge – just click on a live streaming price to open an order ticket and place a trade. You can also modify or close any pending orders.

Volume on charts

Identify price momentum and confirm the existence or continuation of a trend by examining the volume-traded levels in parallel with price movements in real time. You can also look back at historical volume levels to identify historical trends and patterns.

Volume on charts on CMC Markets' CFD Next Generation Platform.

Price Projection

Available on every chart when logged in to your live account, our pattern recognition tool allows you to search for common technical chart and candle patterns, providing a price projection.

Pattern recognition

Let our pattern recognition tool scan for common technical patterns, such as head and shoulders, triangles and wedges, on any open chart across various time intervals, and view the price projection target area on the chart.

Pattern recognition feature on CMC Markets' CFD Next Generation platform.
Price Projection box feature on CMC Markets' Next Generation platform

Price Projection box

​When patterns complete, a price projection box is generated using technical analysis measuring techniques to highlight where the price action could go on the instrument's chart.

​Price has hit the price projection box on average 72.5% of the time across all asset classes (April-October 2016).

Module linking

This feature allows you to group charts together, so that when you change the product shown in one chart, all of the other charts in the group will automatically update to show the new product. This lets you examine the price action for the same product over multiple intervals and timeframes at the same time, so you can compare long-term analysis with short. Drawing tools, technicals, chart types, patterns and presets are all automatically applied to all charts in the group.

Module linking on CMC Markets' Next Generation platform

Chart forum community

The chart forum^ lets you discuss and share chart analysis, trade set-ups and commentary from our analysts and other CMC Markets traders from within the charts.

5.cf2 extra
  • icon analysis
    View expert chart analysisOur global team of market analysts frequently post insightful technical analysis and comments on popular products.
  • icon-chart-line-up
    Copy technical analysisInstantly copy our analysts' and other traders' technical analysis directly on to your own live charts to do further research.
  • icon user-group-48-black
    Comment on postsComment on other traders' posts and use the directional arrows to indicate whether you think the market is going to go up or down.
  • Automated Execution
    Save your analysisUse the chart forum to take a snapshot of your analysis so you can look back at your historical posts to see if your trading ideas went as expected.

^The chart forum is not intended to issue financial promotions, provide investment advice or encourage users to engage in investment activity. Any content posted by us will not have taken your circumstances into account. We are not liable for any course of action you may take or refrain from taking, or any loss or damage suffered by you, as a result of relying on any information provided on the chart forum.


Mobile charting

Our mobile charts, available on our iPhone, iPad and Android™ apps, include over 20 of the most popular technical indicators and 15 drawing tools, plus you can place trades on live streaming prices and edit open orders directly from charts.

Five chart types

Our award-winning mobile apps come with five different chart types: line, bar, spread, heiken-ashi and candlestick charts.

6.-mobile charting2 22 extra
  • icon light-bulb-48-black
    iPad multi-chart viewThe multi-chart view, available with our custom-built iPad app, takes full advantage of the larger screen size, allowing you to scan up to four charts at a time. Compare price action and identify significant market movements across multiple products.
  • icon indicies2
    Trade from chartsJust tap any live streaming price to open an order ticket and place a trade, then edit open orders directly from charts.
  • Automated Execution
    Auto-save analysisAny analysis conducted on a chart opened through a watchlist is automatically saved when you close that chart, so you can easily access that analysis later.
Join over 1,000,000 clients on our award-winning trading platform
Practise trading with $10,000 of virtual funds on a risk-free demo account
Access more than 12,000 financial instruments, including shares, indices and currencies
No hidden fees, tight spreads and low margin rates
Start trading
Support
Support
x

Welcome to CMC Markets Support!

To begin, please select the product your query is related to.