Trend recognition is a critical factor in the success of any trading plan. Many investing strategies seek to profit from trending markets. The idea is to enter the market when a new trend starts and to hold your position open until there’s an indication that the trend is ending.
Primary indicators
Technical analysts use a set of tools to assist them with this process. Some tools tell you what the current trend is, others can be useful in helping you to decide if the current trend is about to change. These tools include price patterns as well as indicators and studies. To use these effectively, however, you first need to understand what a trend is.
What exactly is a trend?
A trend is simply the general direction in which a price is tending to move. Technical analysis uses a stricter definition. It’s easy enough to see what the general direction of a price has been when you look back at the price history, but it’s not so easy to understand how it affects the current situation. Applying a strict definition helps with this.
An uptrend
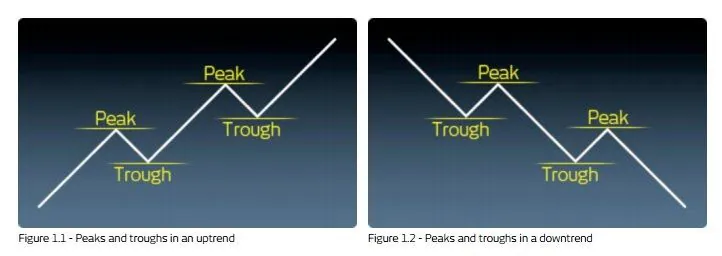
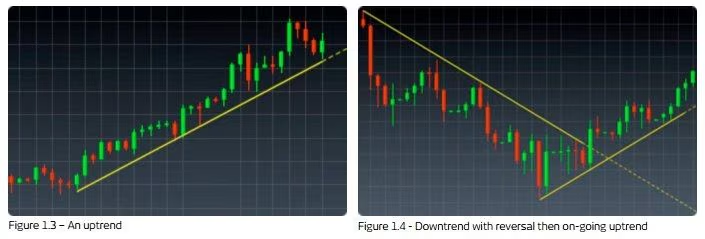
An uptrend is when price follows a succession of higher highs (or peaks) and higher lows (or troughs). See figure 1.1 for a theoretical representation. An uptrend is considered to be intact as long as the price dips against the uptrend stop at higher levels than previous dips.

