This article explains the difference between fundamental and technical analysis so you can pick a form of analysis that is best suited to your trading personality.
- CFD Knowledge Hub
- Trading strategies
- What's the difference between technical and fundamental analysis?
What's the difference between technical and fundamental analysis?

- 1.Fundamental analysis
- 2.Technical analysis
- 3.Choosing between technical and fundamental analysis
- 4.Risk management
Fundamental analysis
Fundamental analysis can be used to evaluate a number of trading instruments, such as shares, indices, currencies and commodities. Some traders will want to weigh up economic factors such as a country’s GDP, unemployment levels, company profitability and the health of a sector before taking a decision to buy or sell. This is all fundamental data.
In shares trading for instance, fundamental analysis can be used to evaluate factors such as the company's performance, news reports, conditions in the sector and more. Let's take for example a trader who uses fundamental analysis as part of his trading strategy. He is trying to determine where shares for Airline XYZ could be headed in the coming days, weeks or months. To do this, he would have to take into account factors such as the cost of oil, tourism numbers and even political unrest that could potentially impact travel within the sectors in which the airline operates. This is because rising oil costs would make flying more expensive for airlines, while political instability would discourage tourism, ultimately impacting profitability and the company's share price.

Technical analysis
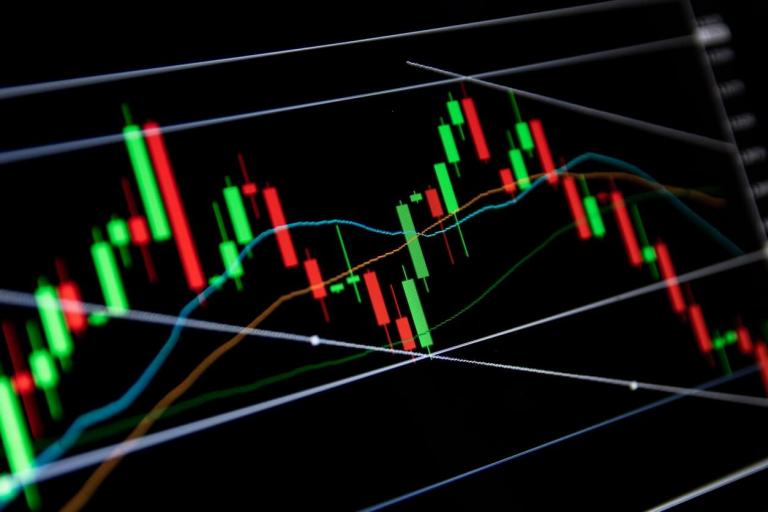
People who just look at price charts are called technical analysts. They argue that everything you need to know about a particular asset, be it a share, forex pair or commodity, is already being reflected in the price. Technical analysts plan their trades and investments based on price trends, chart patterns such as head and shoulders, and more mathematical chart indicators such as moving averages.
For very short-term trading, it’s fair to say that most people lean towards using charts. One obvious reason for this is that many traders are looking for relatively small movements and, although we are probably now exposed to more newsflow than ever before, there just isn’t enough major news that breaks all day long to continuously affects the markets.

Choosing between technical and fundamental analysis
As a new trader, which path should you follow and what approach works best? The honest answer is both! It is possible to make money using either technical or fundamental analysis, but maybe there is a happy middle ground where a blended style could give the best outcome.
It certainly pays to be aware when major fundamental news is being released. At the very least, even the most committed chart traders should know when the various central banks around the world are due to announce interest rate or other policy decisions. This, coupled with the release of major data such as unemployment numbers, can really move the markets. Trading with a head-in-the-sand approach around these releases can be expensive, as market volatility often picks up.
If there is a major change to what everyone was expecting, for example if interest rates go up or unemployment is much higher than expected, it can mean that a few words make chart patterns take a very different direction. But traders can use charts following the announcement to see if sentiment really is changing, or whether the burst of volatility was something of a five-minute wonder.
If a trend on the chart resumes after some unexpected news, then the market clearly does not think the news was actually that important. The person with one eye on the charts could well have the advantage here over those who just watch the news and are convinced that the market should be reacting differently – often a dangerous approach.
Risk management
Risk management is another area where a combination of the technical and fundamental approach could work. Economic news may tell you that the market's attitude towards a certain financial asset is changing but it does not necessarily tell you when your view on the market is wrong. Using traditional chart points such as support and trend, for example, the fundamentally-biased trader can manage the risk on his revised market view if that proves ultimately to be incorrect.
The blended approach can also help confirm trends. If, for example, the majority of people are expecting an interest rate rise, but it doesn’t come, then the currency of that particular country would normally slip back. If it continues to rise then it can be a sign that there are other factors at play here and the interest rate element is not that important. How the market reacts to fundamental news can still be used by the technical trader.
It is maybe not too surprising then that there is no definitive answer to this, and the argument between the fundamental and technical approach is destined to rage on.
As ever there is no silver bullet that will ensure we are right all the time. But there are plenty of different and profitable trading strategies out there – be they purely technical, fundamental or a mix of the two. It’s all about finding a methodology that fits with your own particular trading personality. Find out more information about some trading tools that can be useful when beginning to trade.