Few traders consider what sort of timeframe they should be looking at when using price charts for the instruments they're looking to trade. Choosing the right timeframe for charts is an important part of the trading process.
Many traders use price charts of their chosen markets to figure out points such as where to buy and sell, where to set a stop-loss order and just how much potential profit there could be in their trading idea.
This article has been written with the aim of helping you to pick the best charts and timeframes for the markets you wish to trade.
Picking the right chart timeframes
We are spoilt for choice when it comes to chart data. If we want, we can have a chart that shows every single price change in the market we are watching, tick by tick. Many who are new to trading start by focusing on these very short-term charts. But that is not necessarily the best way, particularly if you are trading markets that are not as volatile hour by hour (ones that do not move too much). Let’s look at a couple of examples:
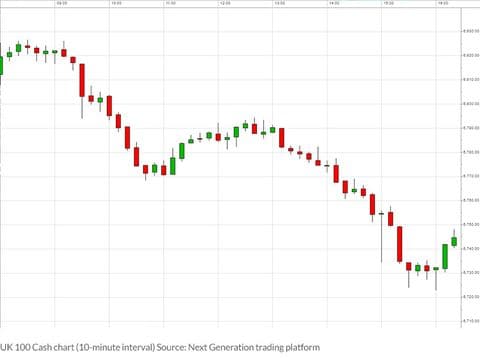
UK 100 10-minute chart

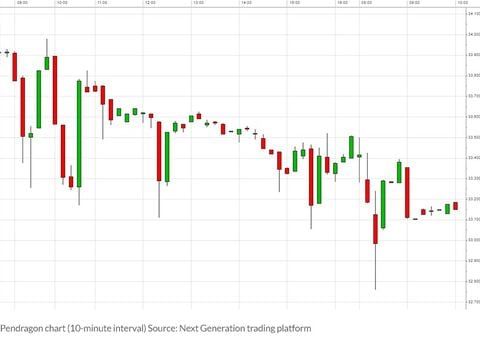
Pendragon 10-minute chart

Both these charts show the trading day in chunks of 10-minute intervals, as indicated by the candlesticks. The first chart, the UK 100 stock market index (which is based on the underlying FTSE 100), has a range of around 100 points on the day. For many short-term traders, this is a very tradeable day and they may see plenty of opportunities to try and make money.
The second chart is of Pendragon, a company listed on the UK stock market. It is not the biggest company on the stock market but is still within the top 350 by size, so is no tiddler. The time period shown is one day but the range on the day was less than two pence!
A day trader watching short-term charts on both these markets will probably be presented with more opportunities in the UK 100 rather than Pendragon. That’s not to say you can’t make money trading shares rather than indices, but it may make more sense to have a longer term view. For example, for many experienced traders of individual shares, a daily candlestick chart does the job perfectly.
Short-term charts vs longer term charts
Using shorter term charts for instruments in volatile markets and longer term charts for quieter markets still isn’t the answer, however.
It helps to remember that longer term charts still have their place even when markets are swinging wildly. You may be following a textbook trend on a chart showing one day of, for example, the pound/US dollar exchange rate (GBP/USD). But it may be a whisker away from what has been a real barrier for many months and you would only see that if you were looking at the bigger picture.
So, when matching charts to various markets, even if you consider yourself a very short-term trader, it does not do any harm at all to examine the longer-term view at the start of your day. There could be a level coming up with the potential to reverse any short-term trend, and this in itself can be another trading opportunity.
CMC Markets is an execution-only service provider. The material (whether or not it states any opinions) is for general information purposes only, and does not take into account your personal circumstances or objectives. Nothing in this material is (or should be considered to be) financial, investment or other advice on which reliance should be placed. No opinion given in the material constitutes a recommendation by CMC Markets or the author that any particular investment, security, transaction or investment strategy is suitable for any specific person.
CMC Markets does not endorse or offer opinion on the trading strategies used by the author. Their trading strategies do not guarantee any return and CMC Markets shall not be held responsible for any loss that you may incur, either directly or indirectly, arising from any investment based on any information contained herein.


