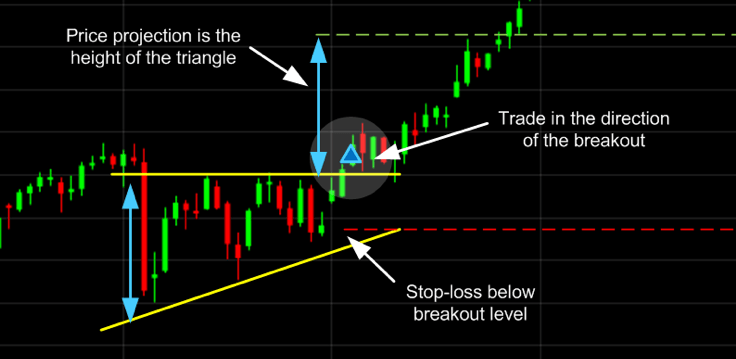
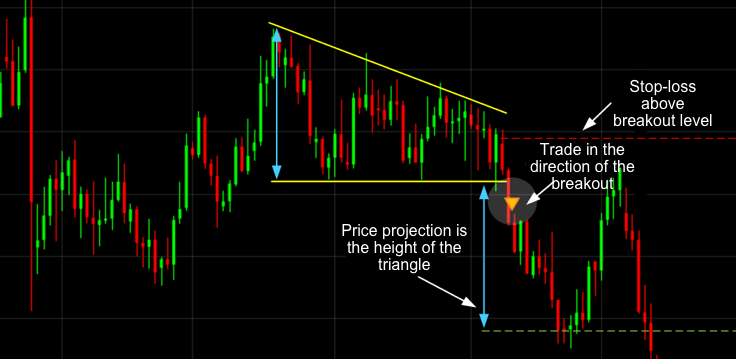
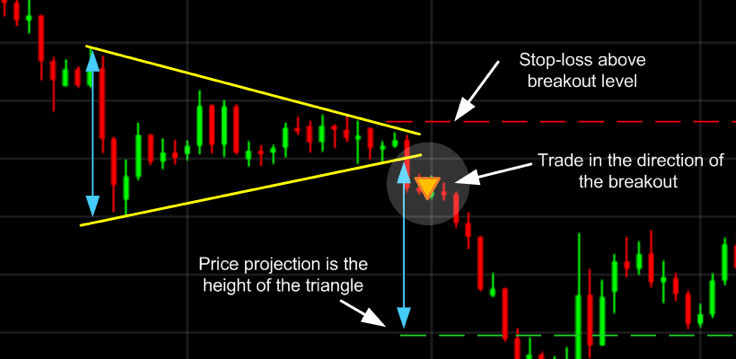
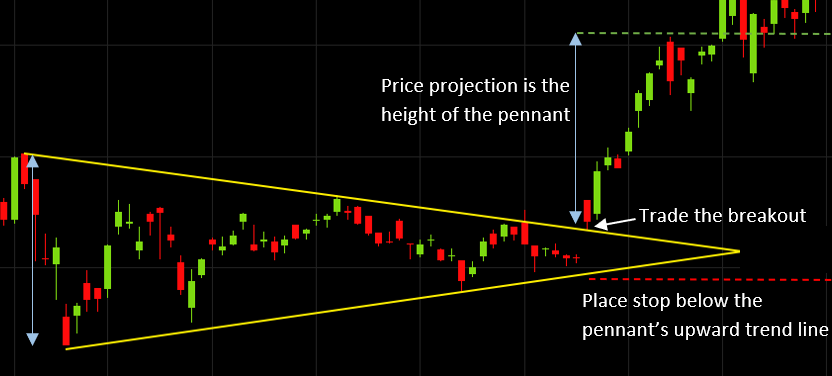
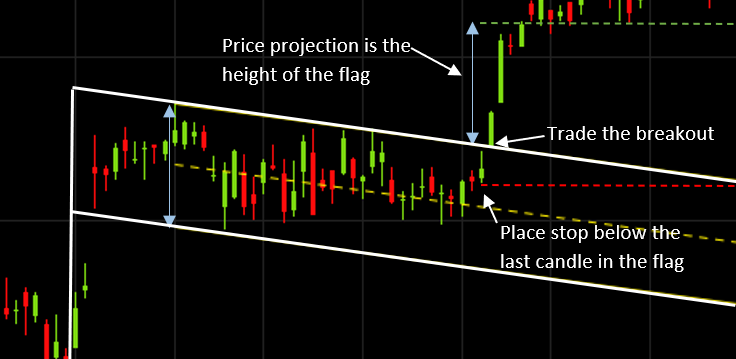
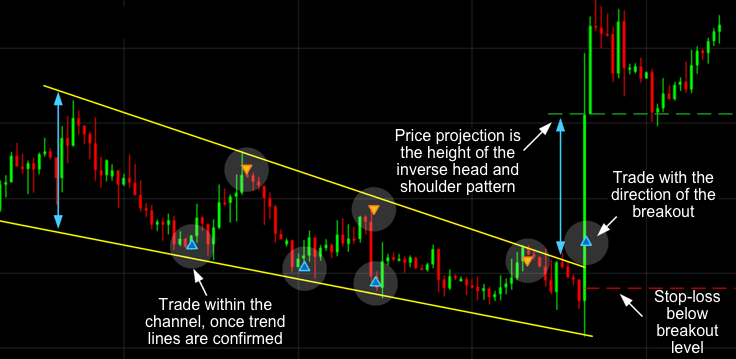
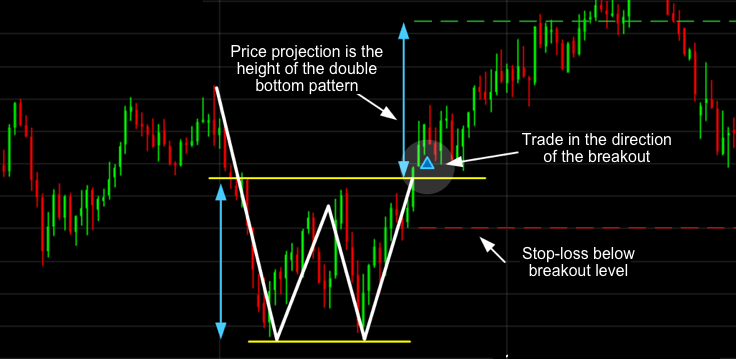
The ascending triangle is a bullish ‘continuation’ chart pattern that signifies a breakout is likely where the triangle lines converge. To draw this pattern, you need to place a horizontal line (the resistance line) on the resistance points and draw an ascending line (the uptrend line) along the support points.
X
Choose your trading platform

CMC Platform
Our Next Generation trading platform combines institutional-grade features and security, with lightning-fast execution and best-in-class insight and analysis.
Trade contract for difference (CFDs) on over 11,000 pairs including FX, indices, commodities, shares, and treasuries.
Now compatible with TradingView.
CMC Platform
MetaTrader 4 Platform (MT4)
Trade on the world's most popular trading platform, with advanced charting tools, EA's and algorithmic trading.
Trade contracts for difference (CFDs) on over 200 products including FX Pairs, Indices and Commodities.
Not compatible with TradingView.
MT4 Platform