US stock markets have consistently lacked breadth over the last few weeks, entering 2025 with notable divergences. Gains are focused on large mega-corporations, supporting capitalisation-weighted indices.
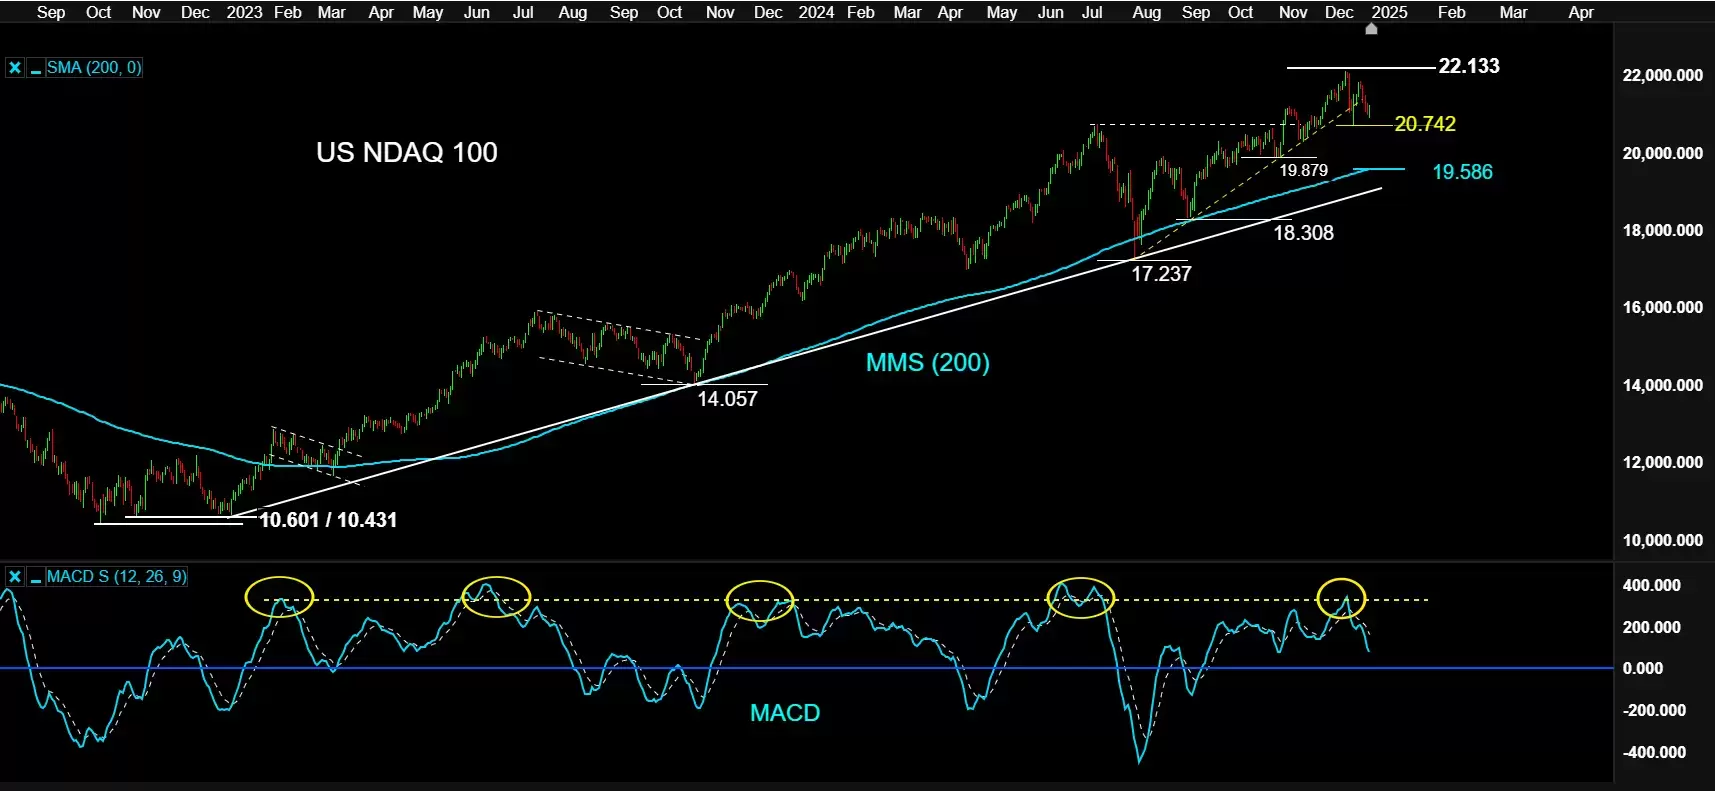
The Nasdaq 100 is the best-performing index but is over-concentrated in a few stocks; the magnificent seven and Broadcom comprise nearly 50% of its weight. The S&P 500, another strong performer (trading over 5% below its 200-day simple moving average (SMA)), also has high concentration, with its top 10 companies accounting for over 40% of the index.

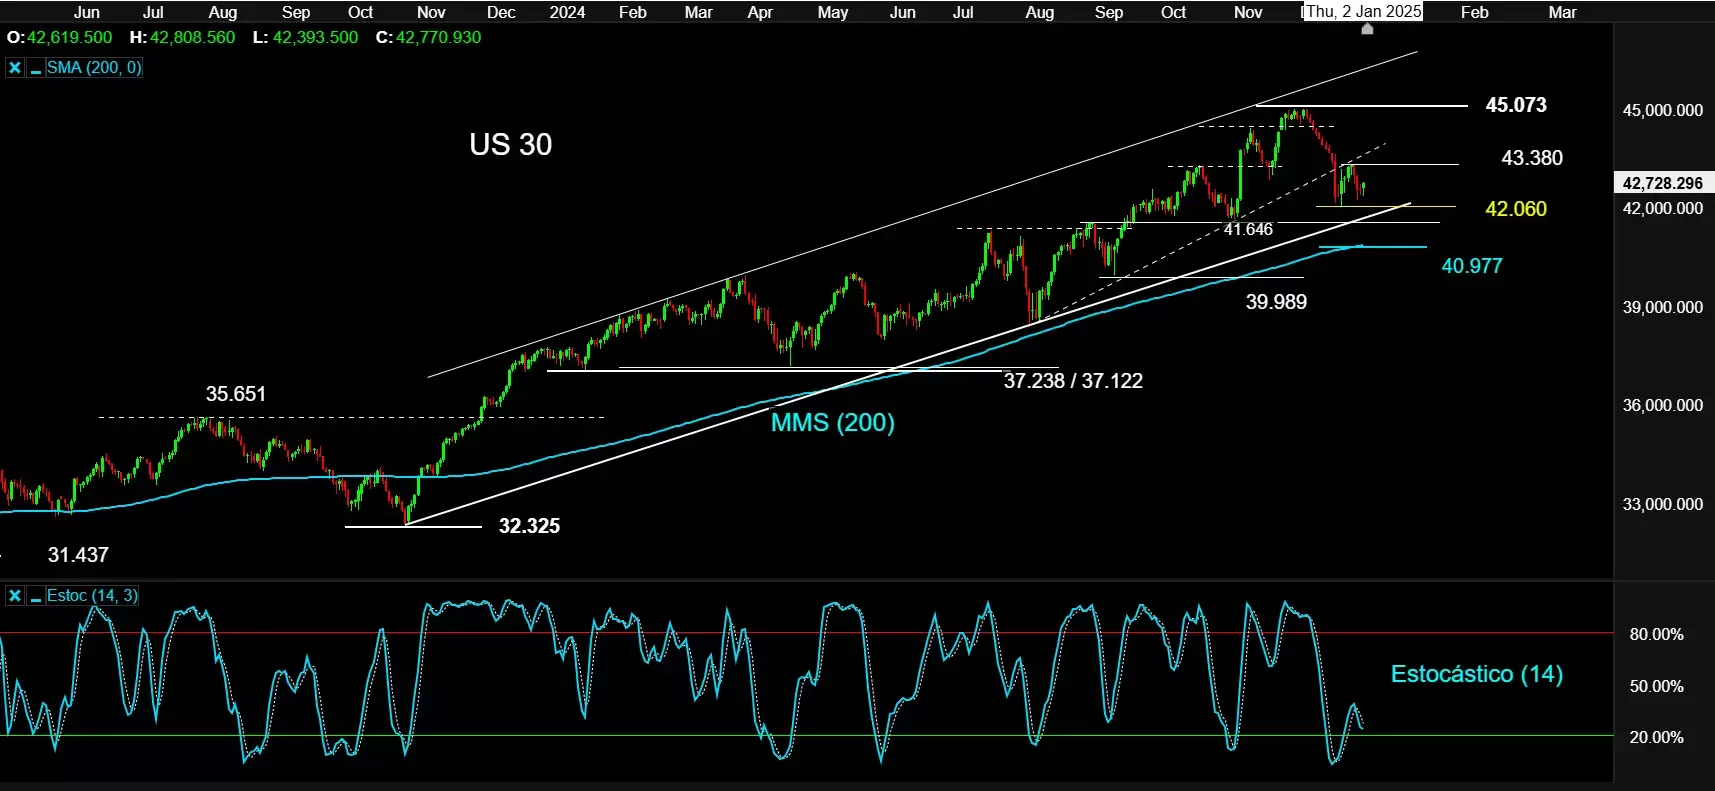
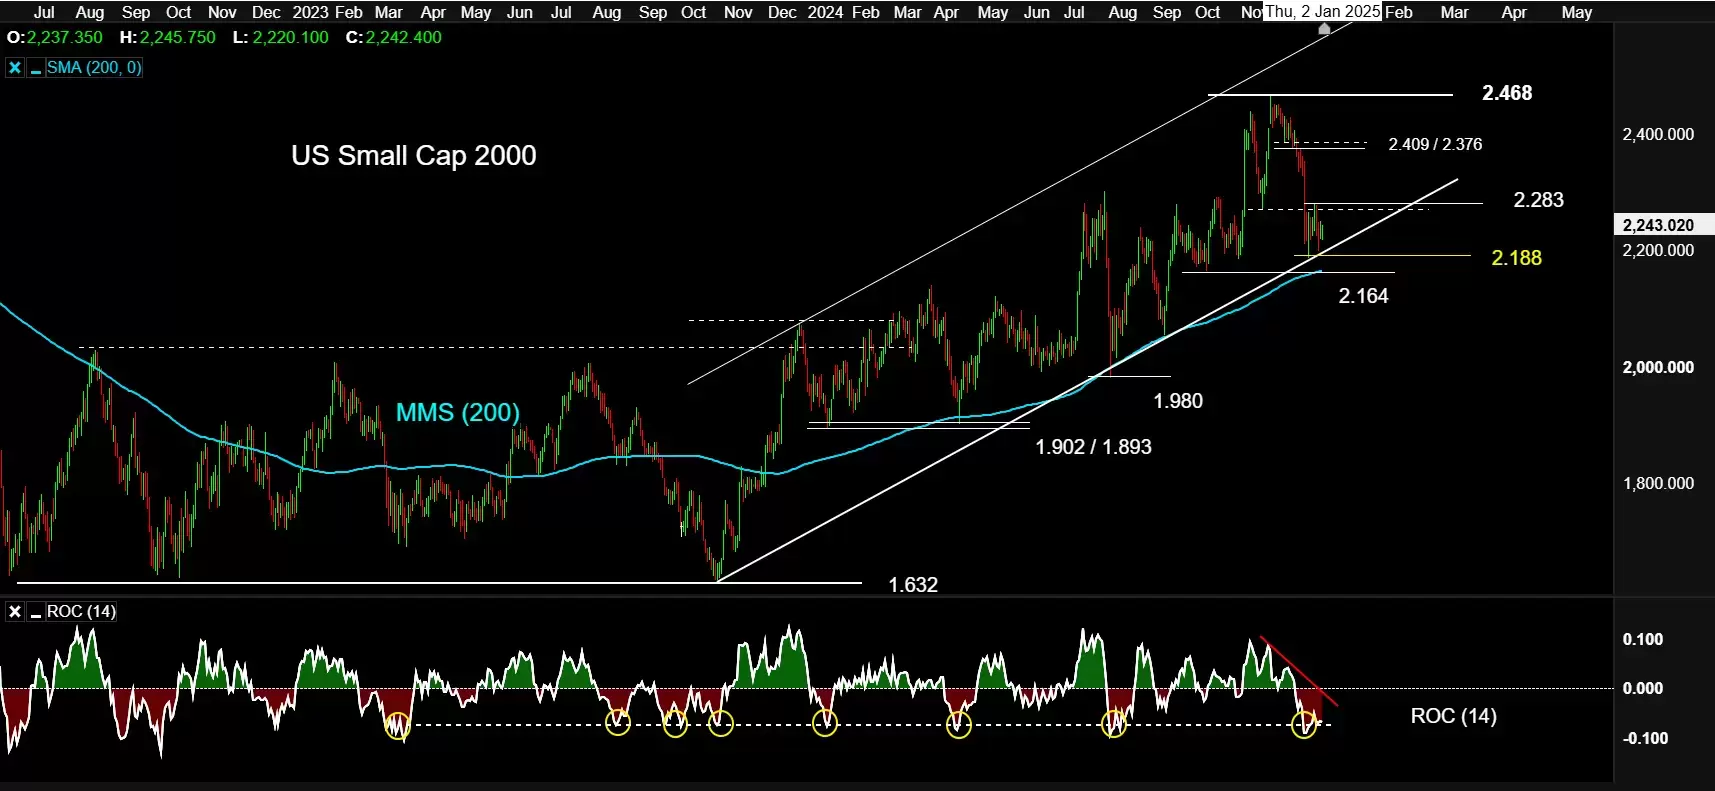
Indices that include smaller companies and aren't weighted by capitalisation have struggled the most, with the Dow Jones and the Russell 2000 trading within 5% of their 200-day SMAs. Price oscillators show overselling, particularly in the Russell 2000, reflecting weaker performance among smaller-cap stocks.

It’s unusual to see the current mean reversion in major indices during the stock market’s historically strong period; December (with its "Christmas rally"), January and February typically show positive trends, driven by factors like tax-related contributions to investment funds and a surplus of cash from bonuses and year-end payments.

This poor performance in a seasonally positive phase is sending stock market indices near December lows: 2,188 for the Russell 2000, 42,060 for the Dow, 20,742 for the Nasdaq 100, and 5 801 for the S&P 500. Failing to hold above these levels during the typically strong first quarter could signal market weakness and the potential for a sideways trend, according to figures from the Stock Trader's Almanac.
CMC Markets erbjuder sin tjänst som ”execution only”. Detta material (antingen uttryckt eller inte) är endast för allmän information och tar inte hänsyn till dina personliga omständigheter eller mål. Ingenting i detta material är (eller bör anses vara) finansiella, investeringar eller andra råd som beroende bör läggas på. Inget yttrande i materialet utgör en rekommendation från CMC Markets eller författaren om en viss investering, säkerhet, transaktion eller investeringsstrategi. Detta innehåll har inte skapats i enlighet med de regler som finns för oberoende investeringsrådgivning. Även om vi inte uttryckligen hindras från att handla innan vi har tillhandhållit detta innehåll försöker vi inte dra nytta av det innan det sprids.


