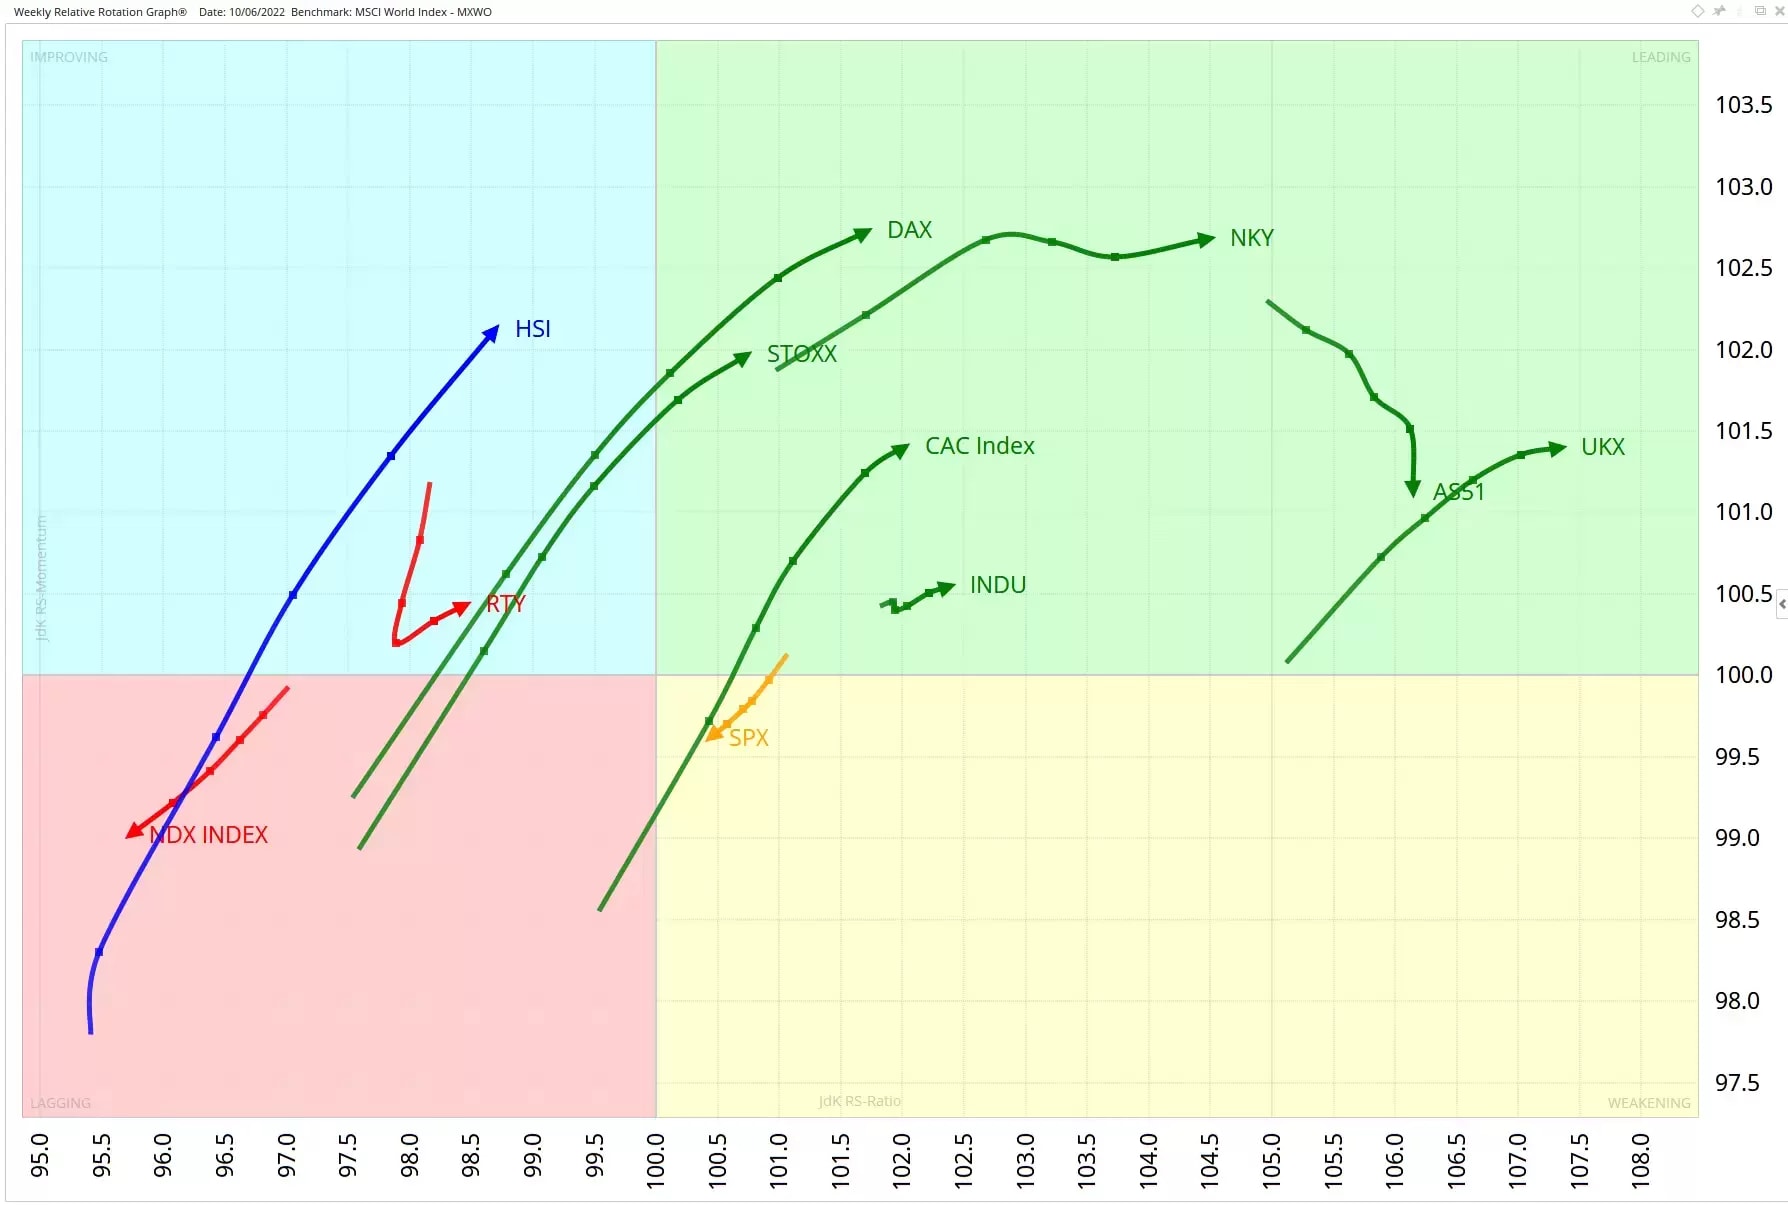
Most major stock indices are in the leading quadrant this week, indicating strong positive momentum relative to the Morgan Stanley Capital International (MSCI) world index. However, the Nasdaq 100 [NDX] and S&P 500 [SPX] are in a relative downtrend versus the MSCI, moving against the world’s other major markets.
Europe on the up
European markets like France’s Cac, Germany’s Dax, the FTSE 100 (UKX) and the pan-European Stoxx index are in relative uptrends, moving to the right of the above Relative Rotation Graph (RRG) over the course of this week. The Stoxx index moved into the leading quadrant (top-right) from the improving quadrant (top-left). In short, European indices are strengthening further versus the rest of the world. There is also continued relative strength for Japan’s Nikkei [NKY] index and Australia’s ASX 200 [AS51].
In contrast, the tech-heavy Nasdaq is in a strongly negative relative trajectory, reflecting the continued aversion among investors towards technology stocks. There is no sign yet that the pressure is abating.
Daily chart underlines US weakness
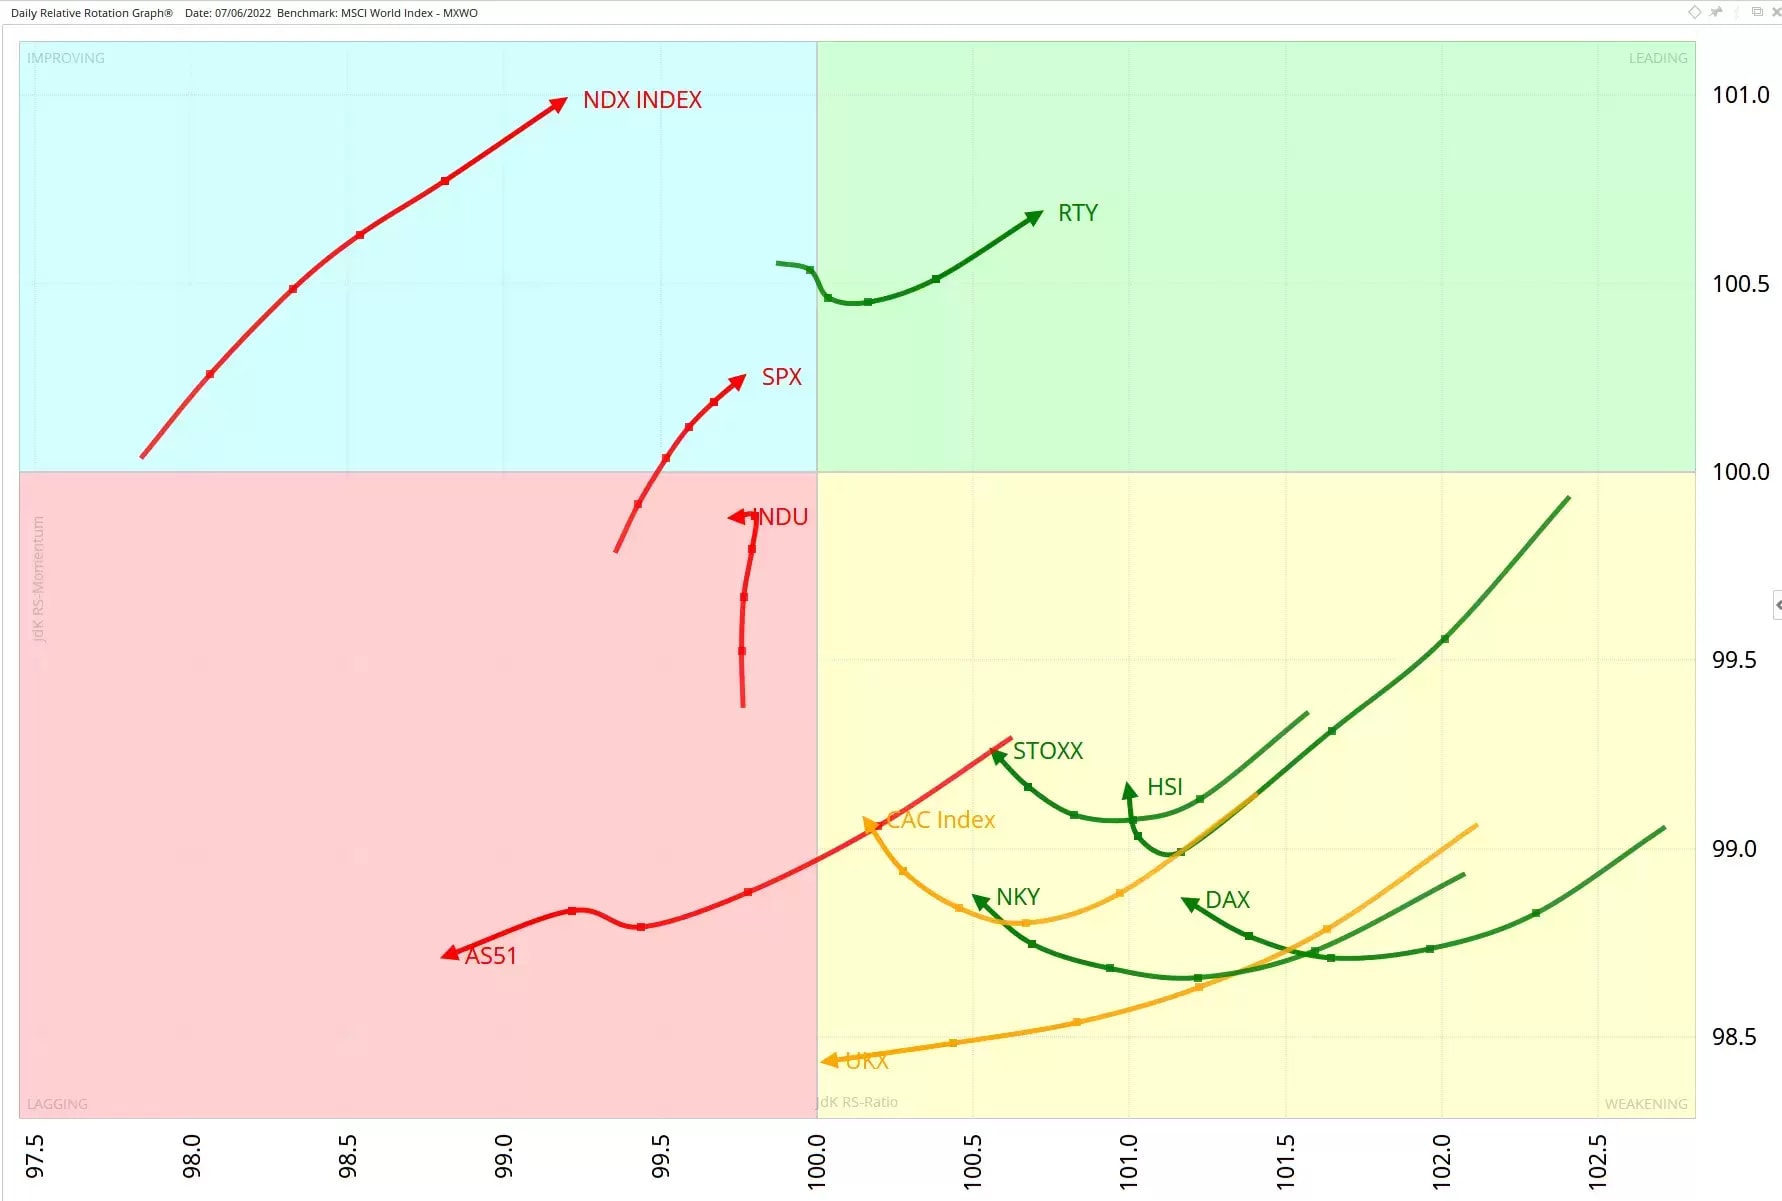
The daily RRG below, captured on 7 June, highlights weak rotation in the US. At the same time, the European markets that are in a positive rotation on the above weekly chart are heading towards the lagging quadrant (lower-left). The Nasdaq is furthest to the left of both our daily and weekly charts, emphasising its relative weakness.
S&P 500 buoyed by energy sector
Last week, the S&P 500 index bounced from support at 3,900, meeting resistance at 4,150. These boundaries are being generated by the June 2021 and March 2022 support lows. This significant support level was broken some weeks ago. Important support, when broken, becomes important resistance. As such, the index is at a strong resistance level. The next serious support is down at the area around 3,500.
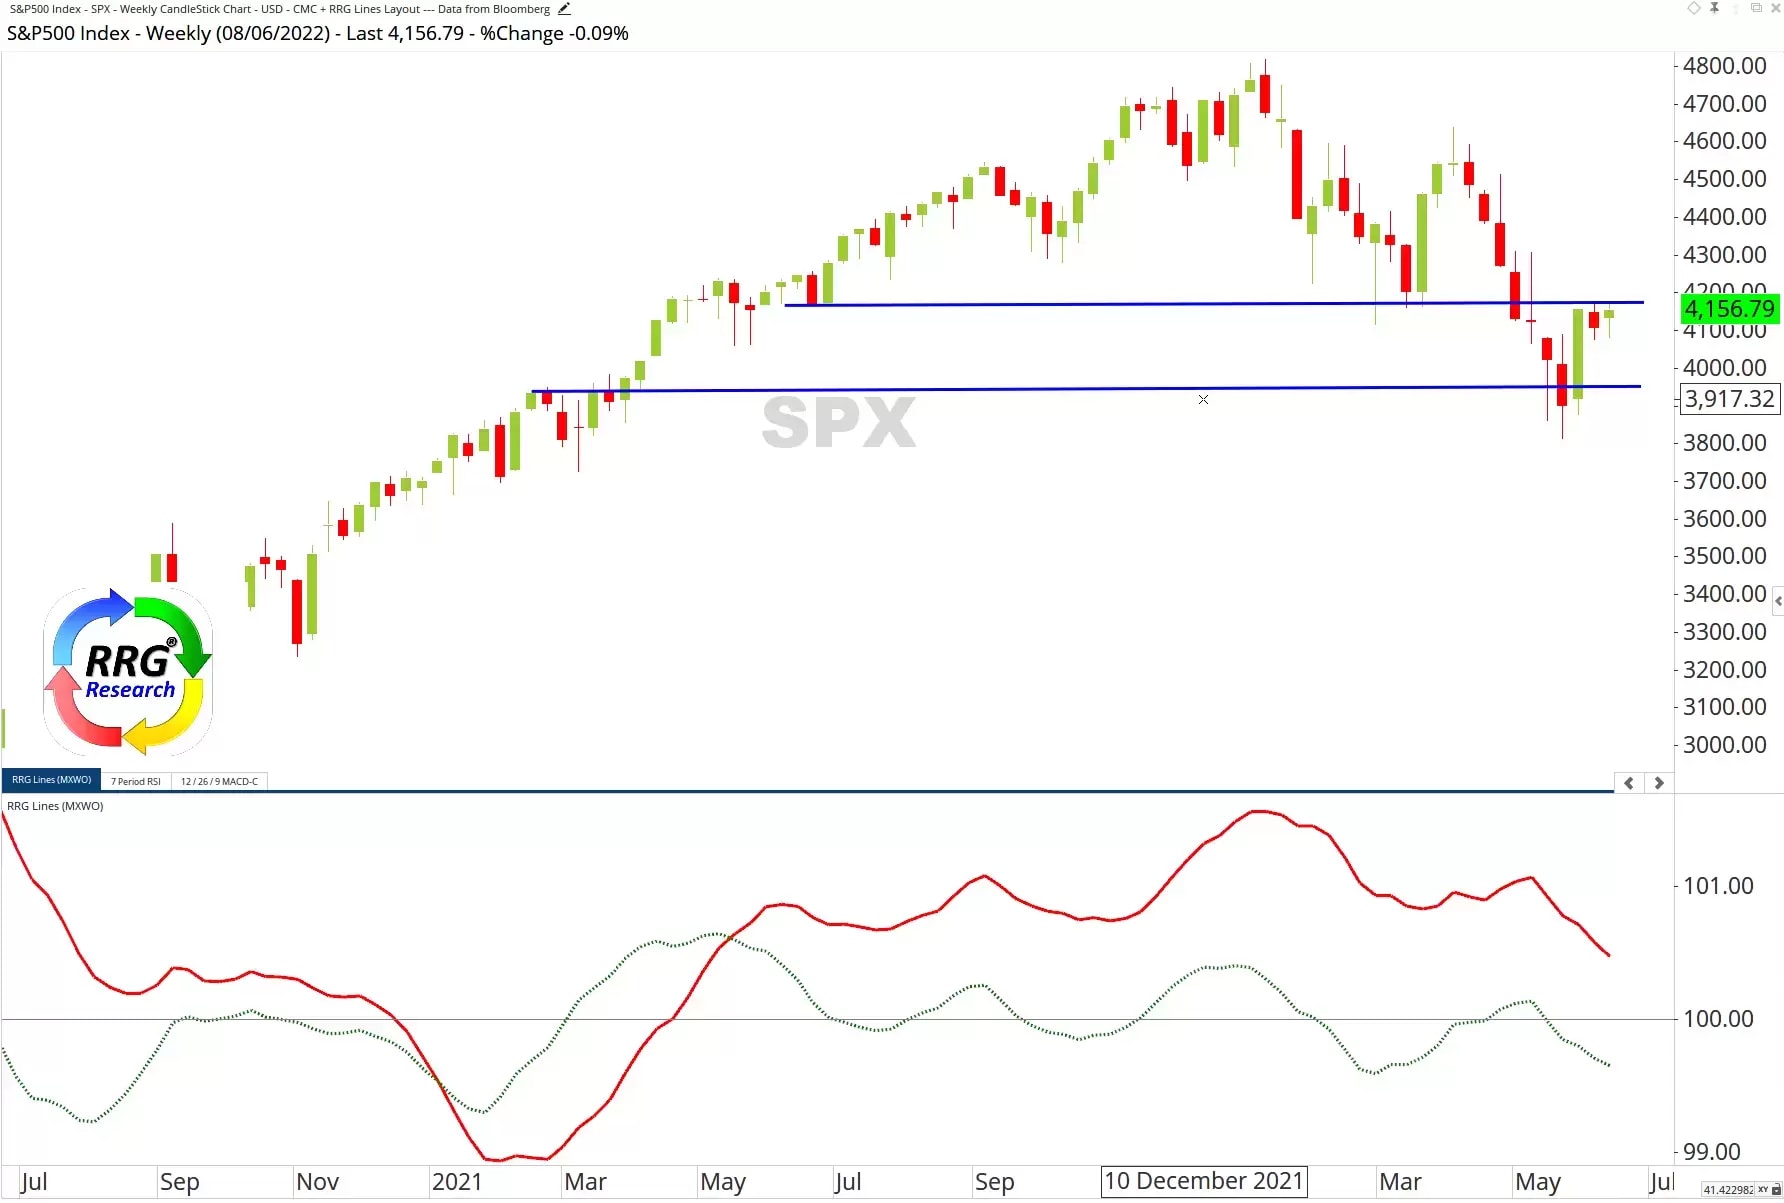
The RRG Lines in the lower part of the above image show a JdK Ratio reading above 100 but a JdK Momentum reading under 100, putting the index in the weakening quadrant of our weekly chart, above.
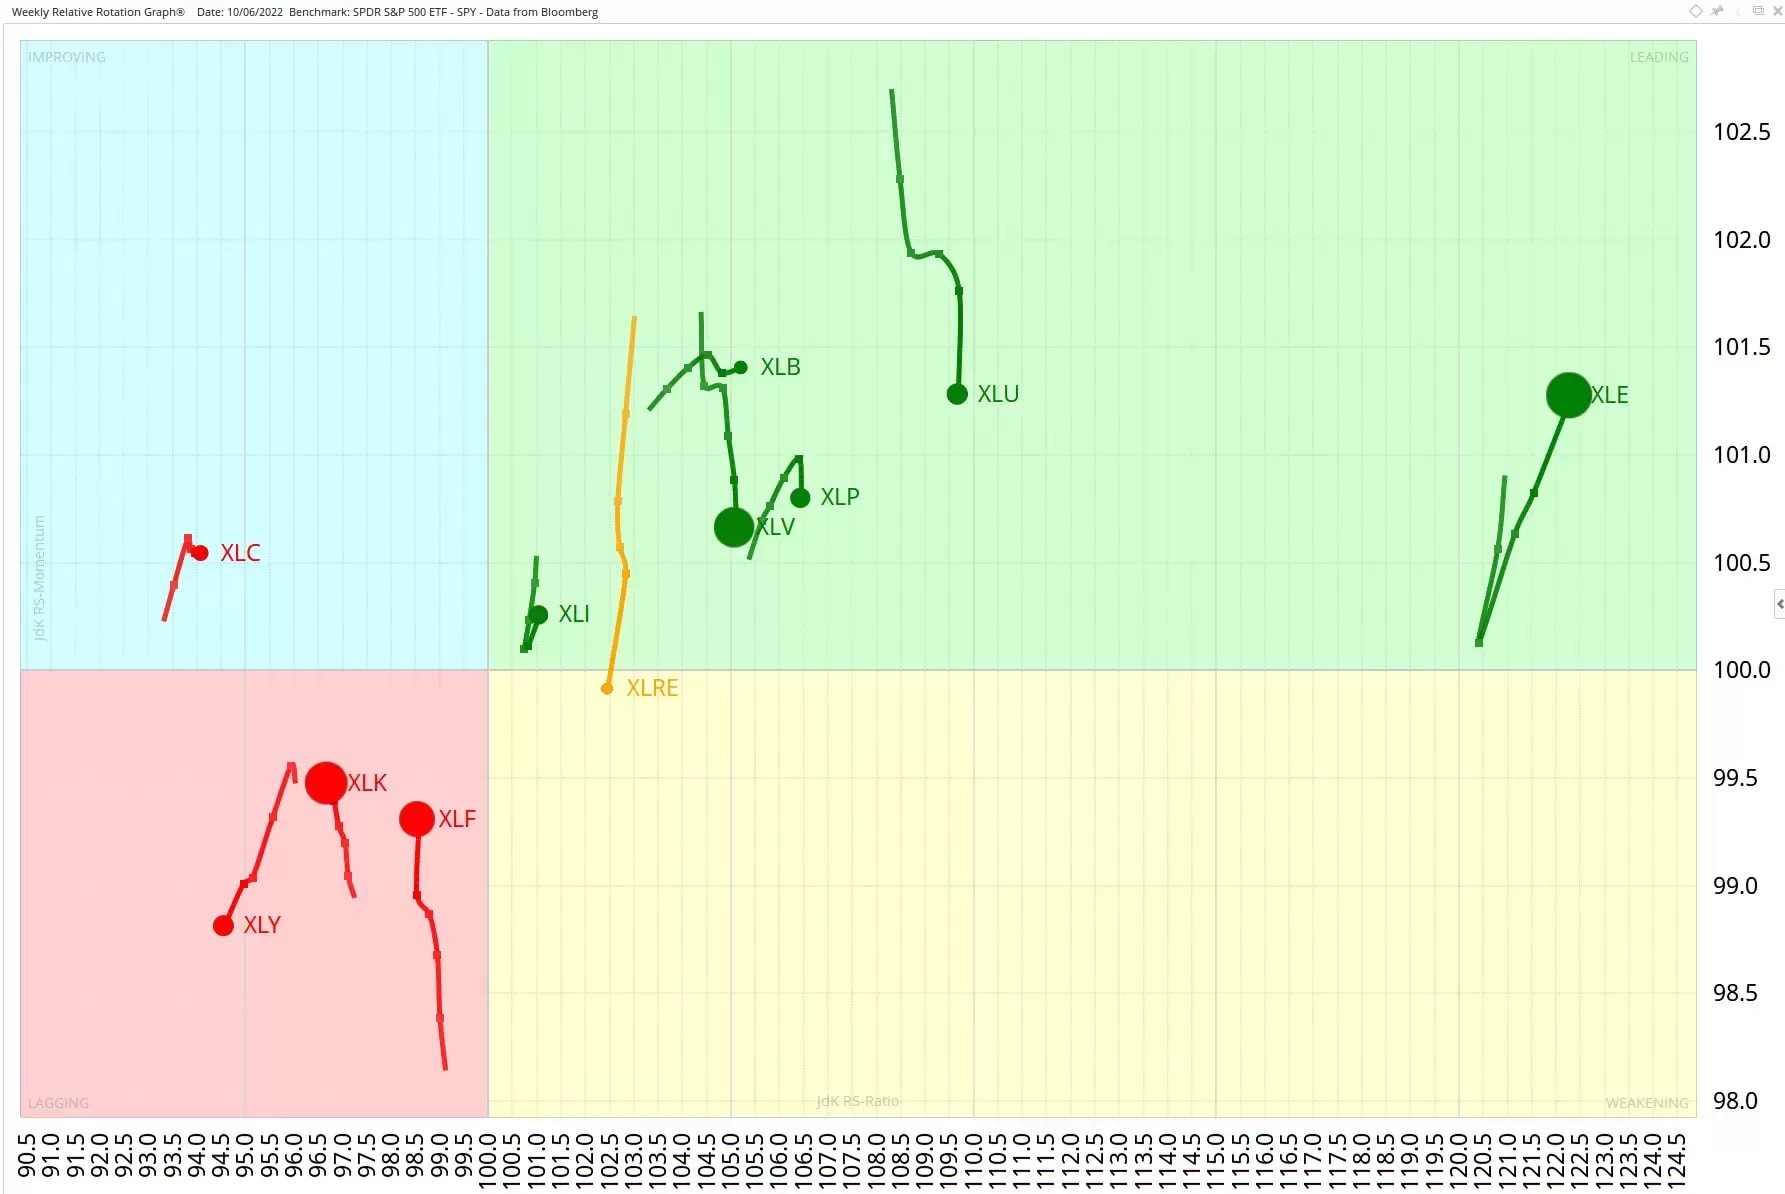
The energy sector has helped prop up the S&P 500, preventing the index from declining more sharply. The RRG below shows US ETFs for different industrial sectors – best in class is the SPDR Energy Select Sector Fund ETF [XLE], which has shown strong positive momentum in recent weeks. Its position to the right of the chart means that XLE has the strongest relative strength of the ETFs shown, with the S&P 500 providing the benchmark.
Energy companies benefiting from rising resource prices
In our previous article, we identified the US Growth Russell 1000 RRG Momentum+ as a share basket to watch, since several natural resource stocks within the basket were performing well, notably Coterra Energy [CTRA], Halliburton [HAL], and Freeport McMoRan [FCX]. This basket remains one of the best performing Momentum+ baskets this quarter.
Looking at the situation from a slightly different perspective, we can see that it is the commodities themselves that are driving this strong performance.
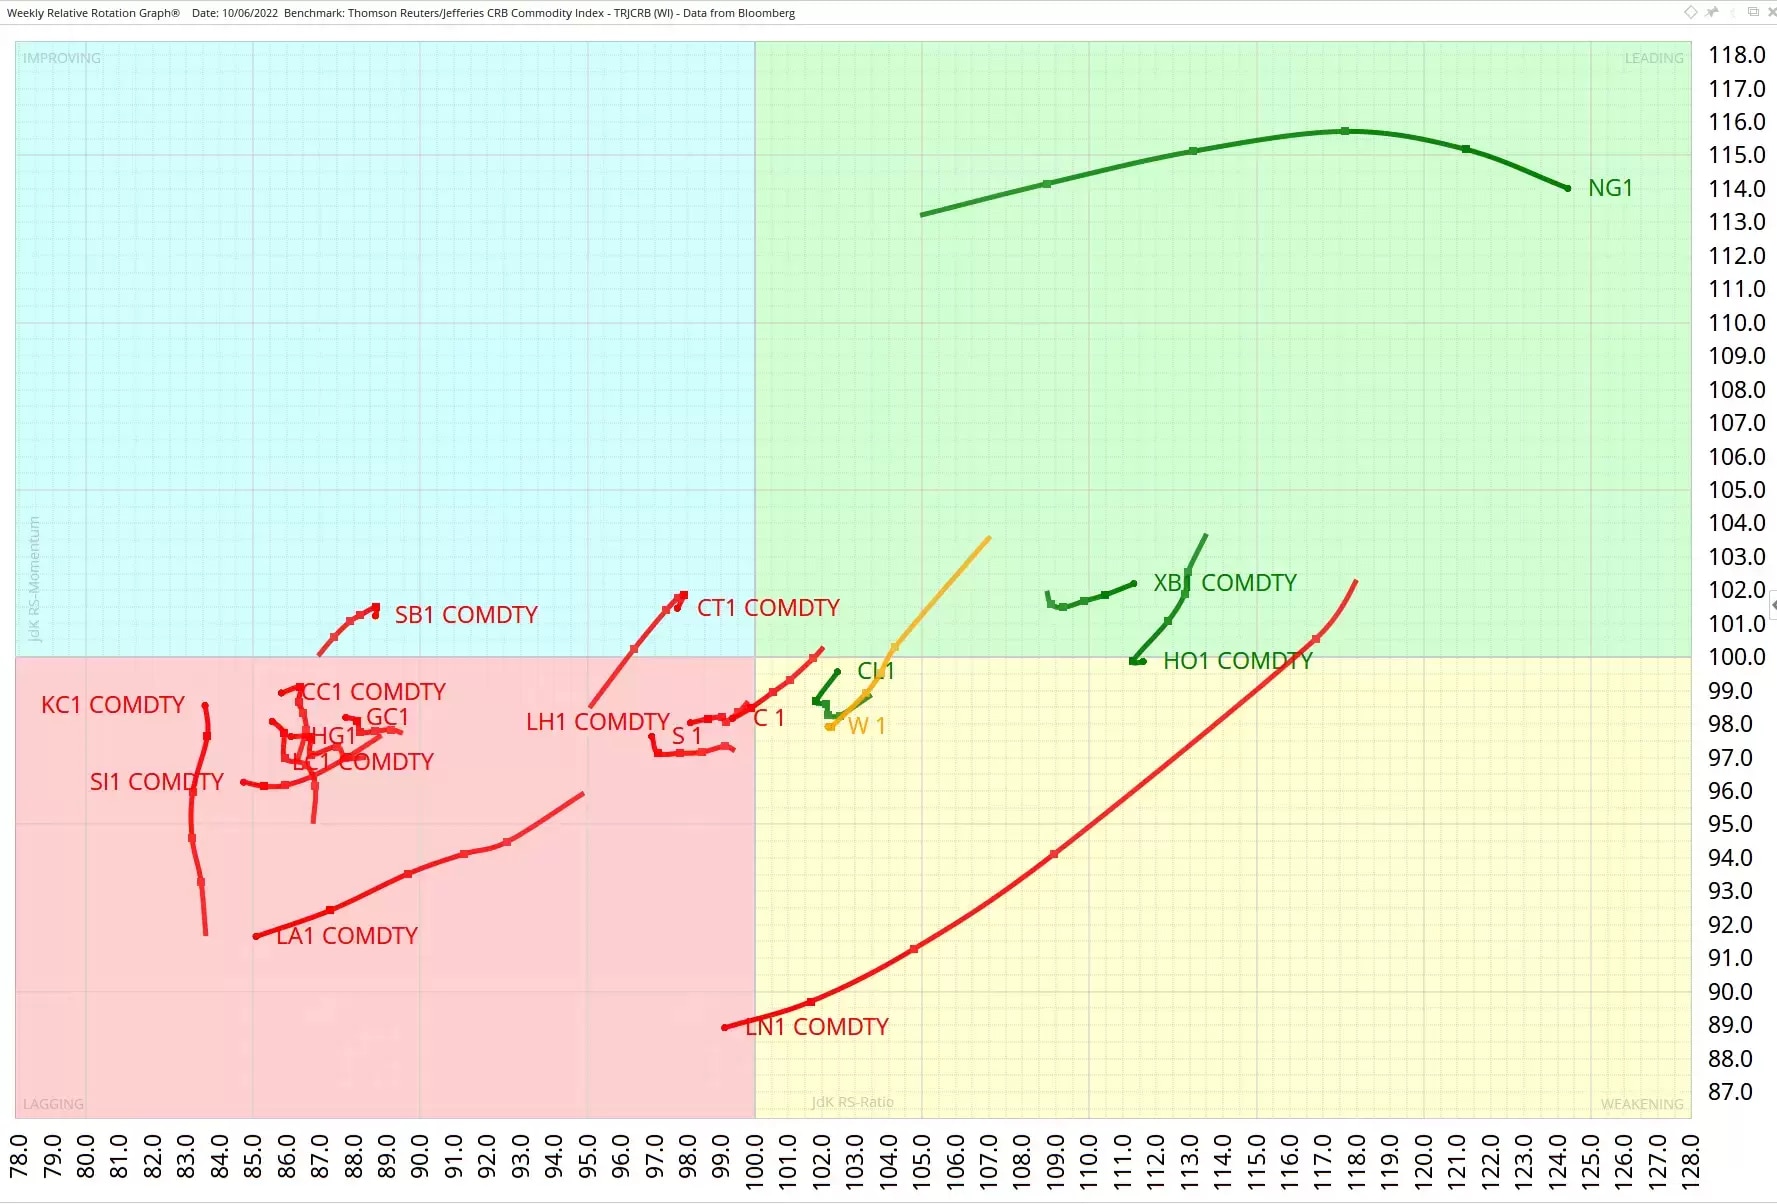
The weekly RRG above shows active commodity futures contracts traded in the US versus the benchmark Thomson Reuters Commodities Research Bureau (CRB) Index. Laggers on the left of the chart include agricultural commodities and metals, such as gold [GC1]. Wheat has a relative-strength ratio of greater than 100, but its trajectory indicates that it will soon join other commodities in the lagging quadrant.
However, we’re most interested in the leaders on the right of the chart. These include WTI Crude [CL1] and other oil products. But the commodity that really stands out is natural gas [NG1], which is moving fast to the right, indicating increased relative strength and positive relative momentum.
Natural gas is this year’s top performer
After falling from a high base in 2009, US natural gas [NG1] traded in a range of $2 to $6 until this year, as the next chart illustrates. This year it broke through that range, which now provides an extensive base that could potentially support a substantial move higher. NG1 is this year’s top-performing commodity, up 149%. Following the break, it has outpaced everything else in the energy and commodity groups. Only Gasoil, which is up 89%, comes close.
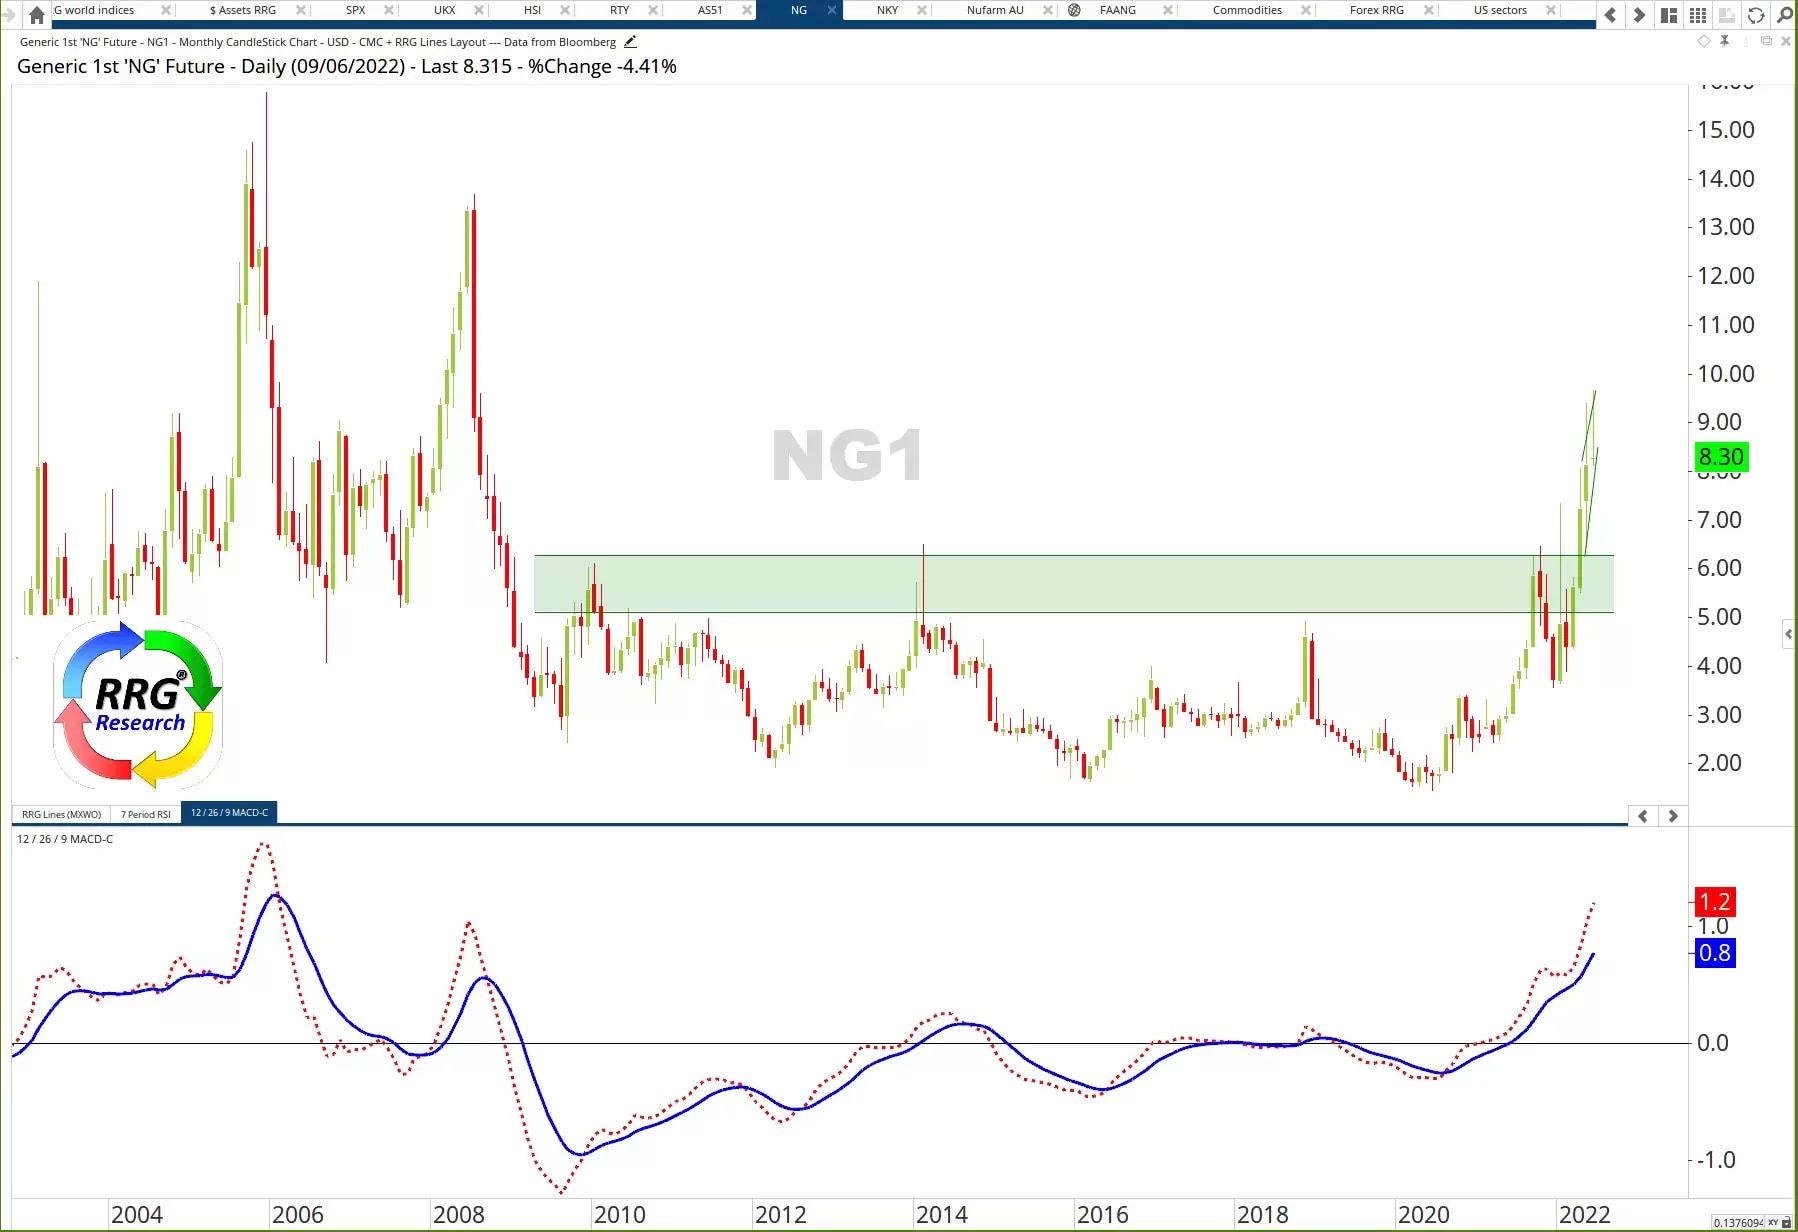
Resistance levels for natural gas come in at $14, with the all-time high at $15. The moves to these peaks in 2005 and 2008 were swift and ended abruptly. Therefore, these levels do not represent strong resistance. The extensive base, the strong break, and the lack of reisistance above may suggest that there is still more upside potential for natural gas, despite having already made significant advances.
Pricing is indicative. Past performance is not a reliable indicator of future results.
CMC Markets erbjuder sin tjänst som ”execution only”. Detta material (antingen uttryckt eller inte) är endast för allmän information och tar inte hänsyn till dina personliga omständigheter eller mål. Ingenting i detta material är (eller bör anses vara) finansiella, investeringar eller andra råd som beroende bör läggas på. Inget yttrande i materialet utgör en rekommendation från CMC Markets eller författaren om en viss investering, säkerhet, transaktion eller investeringsstrategi. Detta innehåll har inte skapats i enlighet med de regler som finns för oberoende investeringsrådgivning. Även om vi inte uttryckligen hindras från att handla innan vi har tillhandhållit detta innehåll försöker vi inte dra nytta av det innan det sprids.

