There are numerous trading strategies, including technical and fundamental analysis, that you could use to improve your forex trading potential.
As a currency trader, it pays to understand what drives market volatility, and to get a better understanding of important support and resistance levels and strategies such as Fibonacci retracements, Bollinger bands, stochastics and more.
One of the things that many traders will look for, whether they are trading short-term for just a few minutes, or longer term over hours and days, is how the forex market reacts near important support and resistance levels. The following strategies can help you set up attractive opportunities.
The bounce strategy
Many traders believe that levels that were important in the past could well be important in the future. If you think about it, this can make a lot of sense. If a market dropped to a level yesterday and then bounced, the market view was that the level had represented something of a bargain. If the forex pair slips back to that level again it could, therefore, signify a potential trading opportunity.
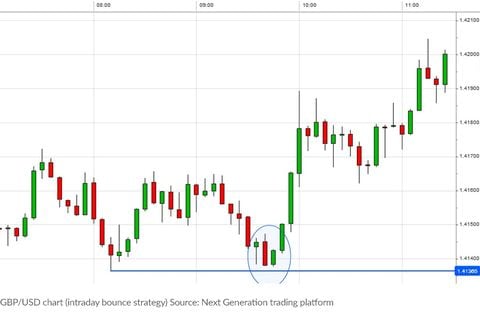
The chart below shows an almost text-book example of the bounce strategy that occurred over a couple of hours (see highlighted area in chart) for GBP/USD.

The running-out-of-steam strategy
Just as traders may view a drop to a previous low as an opportunity to buy, they will also be watching closely if a forex market approaches a previous peak: a level where the market turned and headed back down. If a market is going up but then stalls and turns back, the overall view is likely to be that the price is getting too expensive. The trading approach here is like a mirror image of the bounce strategy. We are looking for the forex pair to run out of steam near that previous high and then sell short to try and profit from a slide in price.
Such strategies, based on previous highs and lows on a chart, can make risk management straightforward for any trader. For instance, if we are looking for a bounce off a level, our stop loss can go below that previous low point. If we are looking to sell short when a market starts to falter near a previous high, then many traders will place a stop loss above that previous high.
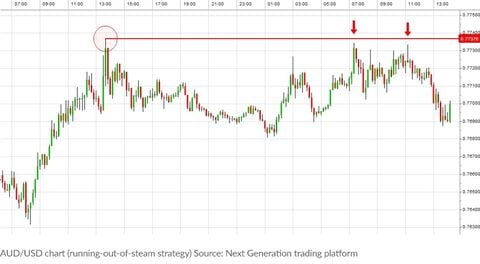
The example below shows how a high from the previous day in the AUD/USD currency pair ended up being the place where the market twice ran out of steam the following morning.

The breakout strategy
Previous highs and lows in the forex market, or any market for that matter, don’t stay unbroken forever. If they did, markets would go nowhere and just trade sideways day in, day out. At some point an old high will get broken. Many traders view this as a potentially important change in market sentiment. Previously when the forex pair was up at that high, the sellers moved in and the price fell, suggesting the market had got overvalued. If that old high is breached, also known as breaking resistance, then something has clearly changed. Traders are now happy to keep on buying where previously they thought the price was too expensive.
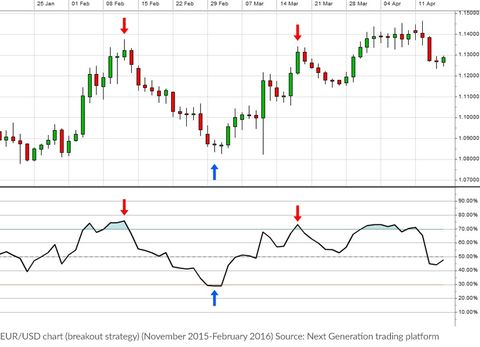
This can be an effective trading strategy for catching new trends. Every journey starts with a single step. When direction in the markets changes then the breakout trading strategy is often one of the early signals. The example shown is for EUR/USD – a longer term breakout on the daily charts.

The breakdown strategy
If there is a trading strategy designed to jump on board a move through a previous high for a forex pair, then it stands to reason that there must be one for when a forex market slips below a previous low. Once again, many traders will view this as a change in sentiment towards the market. Suddenly a level where buyers were happy to step in because they viewed the market as cheap and expected it to rise – has been broken. This break through what is known as a support level can be viewed as an opportunity to short sell and try to profit from further weakness in price.
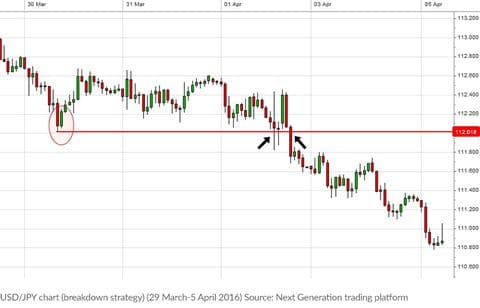
The example shows USD/JPY on an hourly chart. It is an important example as it demonstrates that, in the real world, even the best forex trading strategies do not work all the time. There is a false signal (highlighted by the circle) before the effective signal (highlighted by the black arrows) that saw the market really start to fall.

Overbought/oversold
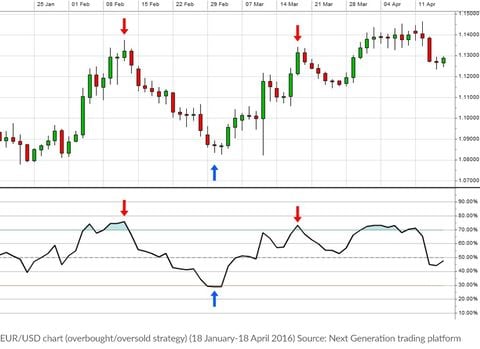
The forex trading strategies mentioned so far have been based on chart patterns. Our last strategy takes a more mathematical approach, using something called the Relative Strength Index (RSI). This belongs to a family of trading tools known as oscillators – so called because they oscillate as the markets move around. When the RSI is above 70%, the market is thought to be overbought. This means that it could be getting overstretched and some traders will use this as a signal to expect the market to fall back.
Oversold is when the RSI goes below 30%. Traders will be watching closely, expecting any weakness to run out of steam and the market to turn back up and use this as a buy signal. The example in this chart highlights some of the buy and sell signals that came from the overbought/oversold strategy on a daily EUR/USD chart.

Of course when it comes to forex trading strategies, nothing works all the time, every time. But these five strategies, used with a sensible approach to managing risk, can highlight lots of opportunities across a wide range of forex markets.
Disclaimer
CMC Markets is an execution-only service provider. The material (whether or not it states any opinions) is for general information purposes only, and does not take into account your personal circumstances or objectives. Nothing in this material is (or should be considered to be) financial, investment or other advice on which reliance should be placed. No opinion given in the material constitutes a recommendation by CMC Markets or the author that any particular investment, security, transaction or investment strategy is suitable for any specific person.
CMC Markets does not endorse or offer opinion on the trading strategies used by the author. Their trading strategies do not guarantee any return and CMC Markets shall not be held responsible for any loss that you may incur, either directly or indirectly, arising from any investment based on any information contained herein.


