After three days of heavy selling, the S&P 500 fell to a key support zone near 3,800 points on Monday, writes Gary Morrow. This area – between 3,820 and 3,760 – supported multi-week lows in late December and early January. The index’s powerful breakout gap, left behind on 10 November, is also in this zone. Will the index build momentum now that it has firm support levels? Or does more sideways action lie ahead? This article attempts to answer these questions, and also considers where the Nasdaq may be heading.
Keeping tabs on the S&P’s 200-day moving average
The S&P 500 has a flatlining 200-day moving average (DMA). This key indicator, which supported the lows in February and early March, is back in a resistance position. Going back to the early stages of the 2022 bear market, the 200-DMA has capped numerous rallies. It is therefore worth monitoring in the near term.
Many traders were disappointed that the S&P 500 was unable to hold above the 200-DMA after the 50-DMA rose above the 200-DMA in early February – a bullish pattern known as a golden cross. In January, the index had risen above its 200-DMA, driven by heavy buying.
A weekly close back above the 200-DMA (around 3,939) could boost bulls’ confidence. However, on the downside, a key level to monitor is the 3,760 area. A close below this marker would violate the December and January lows, and would also negate the gap support zone created by the 10 November breakout. This gap at 3,818 is the bedrock that has kept the S&P 500’s downside in check since mid-December.
Nasdaq sinks to key support level
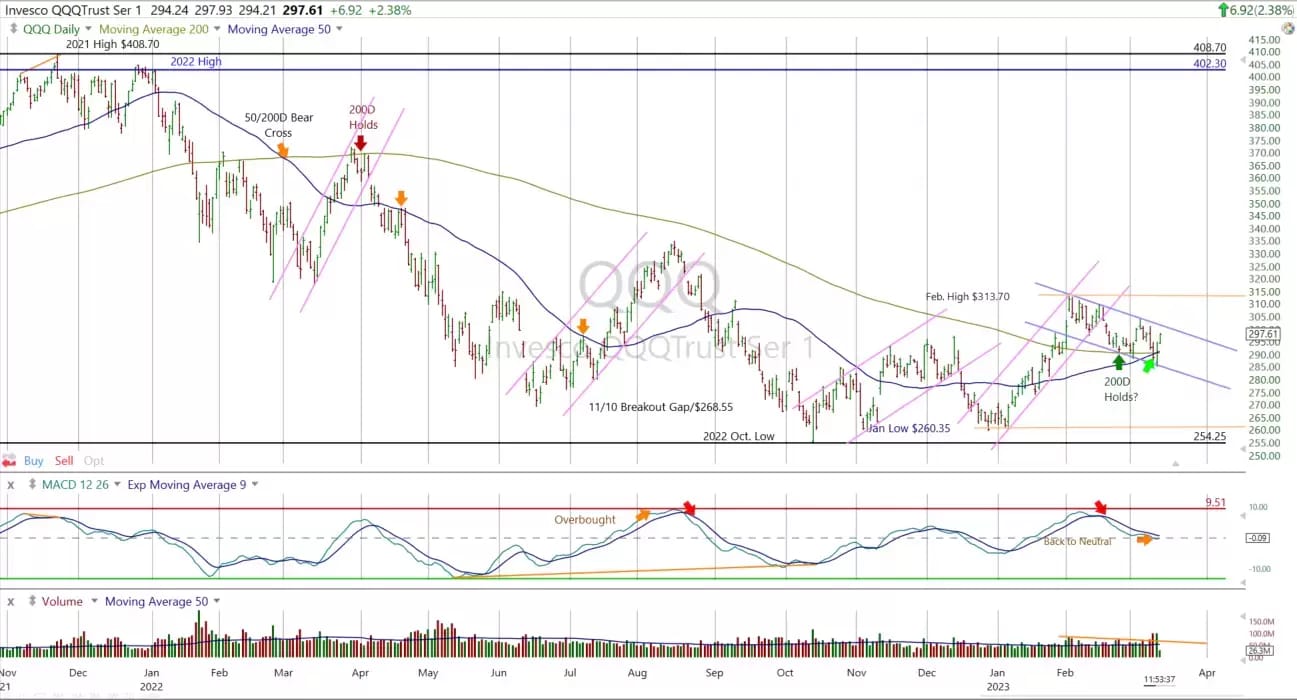
The Nasdaq 100 absorbed a tremendous amount of pressure last week. Despite this selling wave, the index continues to hold key support. The 200-DMA, which provided heavy resistance a year ago at the time of the March 2022 highs, has propped up the February and March multi-week lows. The 200-DMA has also helped to contain the pullback from the early February highs, while tracing out a bullish flag.
Aiding the 200-DMA support area is a rising 50-DMA. Soon, the 50-DMA will cross above the 200-DMA for the first time since May 2020. Back then, the golden cross pattern confirmed a powerful rally. By 1 September 2020, the Invesco QQQ Trust Series 1 ETF, which tracks the Nasdaq 100, had gained just over 30%.
QQQ, a Nasdaq 100-trackling ETF, November 2021 - present

Also working in favour of an upside resolution to the current pullback is a neutral moving average convergence/divergence (MACD). This momentum indicator has reached elevated levels near each bear market rally since last March. The MACD’s overbought reading in early February has fallen back towards a neutral setting without the QQQ ETF giving up much ground.
Regarding QQQ, a key level to watch in the near term is the March high around $304. A close above that area would violate the upper band of the bull flag pattern. This could spark a fresh rally. To the downside, a clear take-out of the $285 area would violate an important support zone, potentially triggering a deeper pullback. This key area includes the 200-DMA and 50-DMA, as well as the March low.
Disclaimer: This report contains independent commentary to be used for informational and educational purposes only. Gary Morrow is an investment adviser representative with LifePro Asset Management, LLC. Mr. Morrow is not affiliated with this company and does not serve on the board of any related company that issued this stock. All opinions and analyses presented by Gary Morrow in this analysis or market report are solely Gary Morrow’s views. Readers should not treat any opinion, viewpoint, or prediction expressed by Gary Morrow as a specific solicitation or recommendation to buy or sell a particular security or follow a particular strategy. Gary Morrow's analyses are based upon information and independent research that he considers reliable, but neither Gary Morrow nor LifePro Asset Management guarantees its completeness or accuracy, and it should not be relied upon as such. Gary Morrow is not under any obligation to update or correct any information presented in his analyses. Gary Morrow's statements, guidance, and opinions are subject to change without notice. Past performance is not indicative of future results. Past performance of an index is not an indication or guarantee of future results. It is not possible to invest directly in an index. Exposure to an asset class represented by an index may be available through investable instruments based on that index. Neither Gary Morrow nor LifePro Asset Management guarantees any specific outcome or profit. You should know the real risk of loss in following any strategy or investment commentary presented in this analysis. Strategies or investments discussed may fluctuate in price or value. Investments or strategies mentioned in this analysis may not be suitable for you. This material does not consider your particular investment objectives, financial situation, or needs and is not intended as a recommendation appropriate for you. You must make an independent decision regarding investments or strategies in this analysis. Upon request, the adviser will provide a list of all recommendations made during the past 12 months. Before acting on information in this analysis, you should consider whether it is suitable for your circumstances and strongly consider seeking advice from your own financial or investment adviser to determine the suitability of any investment. Gary Morrow received compensation for this article.
Disclaimer: CMC Markets is an execution-only service provider. The material (whether or not it states any opinions) is for general information purposes only, and does not take into account your personal circumstances or objectives. Nothing in this material is (or should be considered to be) financial, investment or other advice on which reliance should be placed. No opinion given in the material constitutes a recommendation by CMC Markets or the author that any particular investment, security, transaction or investment strategy is suitable for any specific person. The material has not been prepared in accordance with legal requirements designed to promote the independence of investment research. Although we are not specifically prevented from dealing before providing this material, we do not seek to take advantage of the material prior to its dissemination.


